New: Crash by device breakdown for easier mobile debugging
Posted Aug 9, 2018 | 2 min. (361 words)The Raygun platform is designed to surface as much actionable information about errors so, as a developer, you not only fix them quickly but gain context into what causes errors in the first place.
Today we’re announcing a new feature for both Crash Reporting and Real User Monitoring: Crash by device.
This new feature helps mobile developers understand which devices cause the most crashes, so replicating errors becomes easier.
Where can I find Crash by device?
All plans have access to the Crash by device feature, and there’s nothing to set up. Here’s where to find it in both Crash Reporting and Real User Monitoring.
Crash Reporting
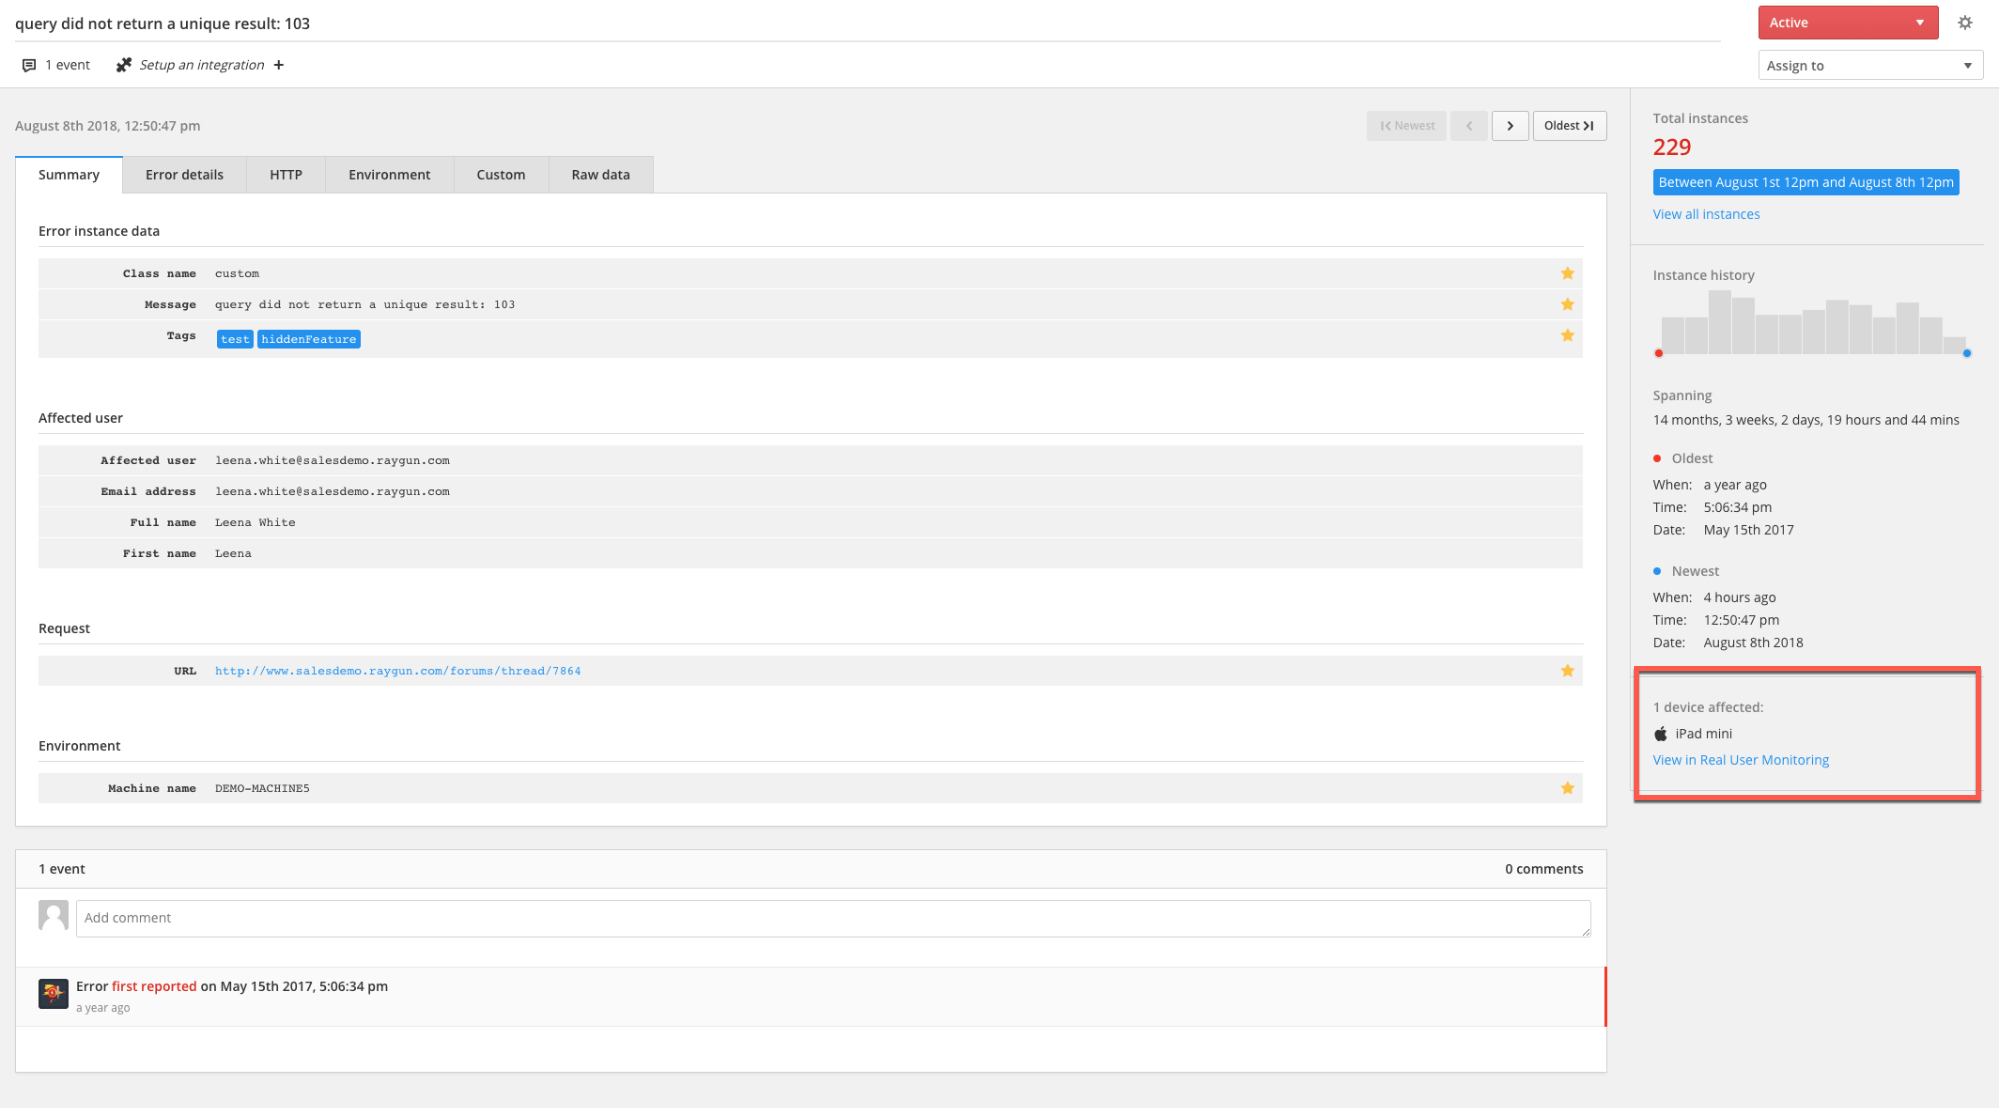
When you visit the ‘Error details’ page, we’ve added a new heading in the sidebar where you will see a percentage breakdown of devices affected. See the following screenshot for what that looks like:

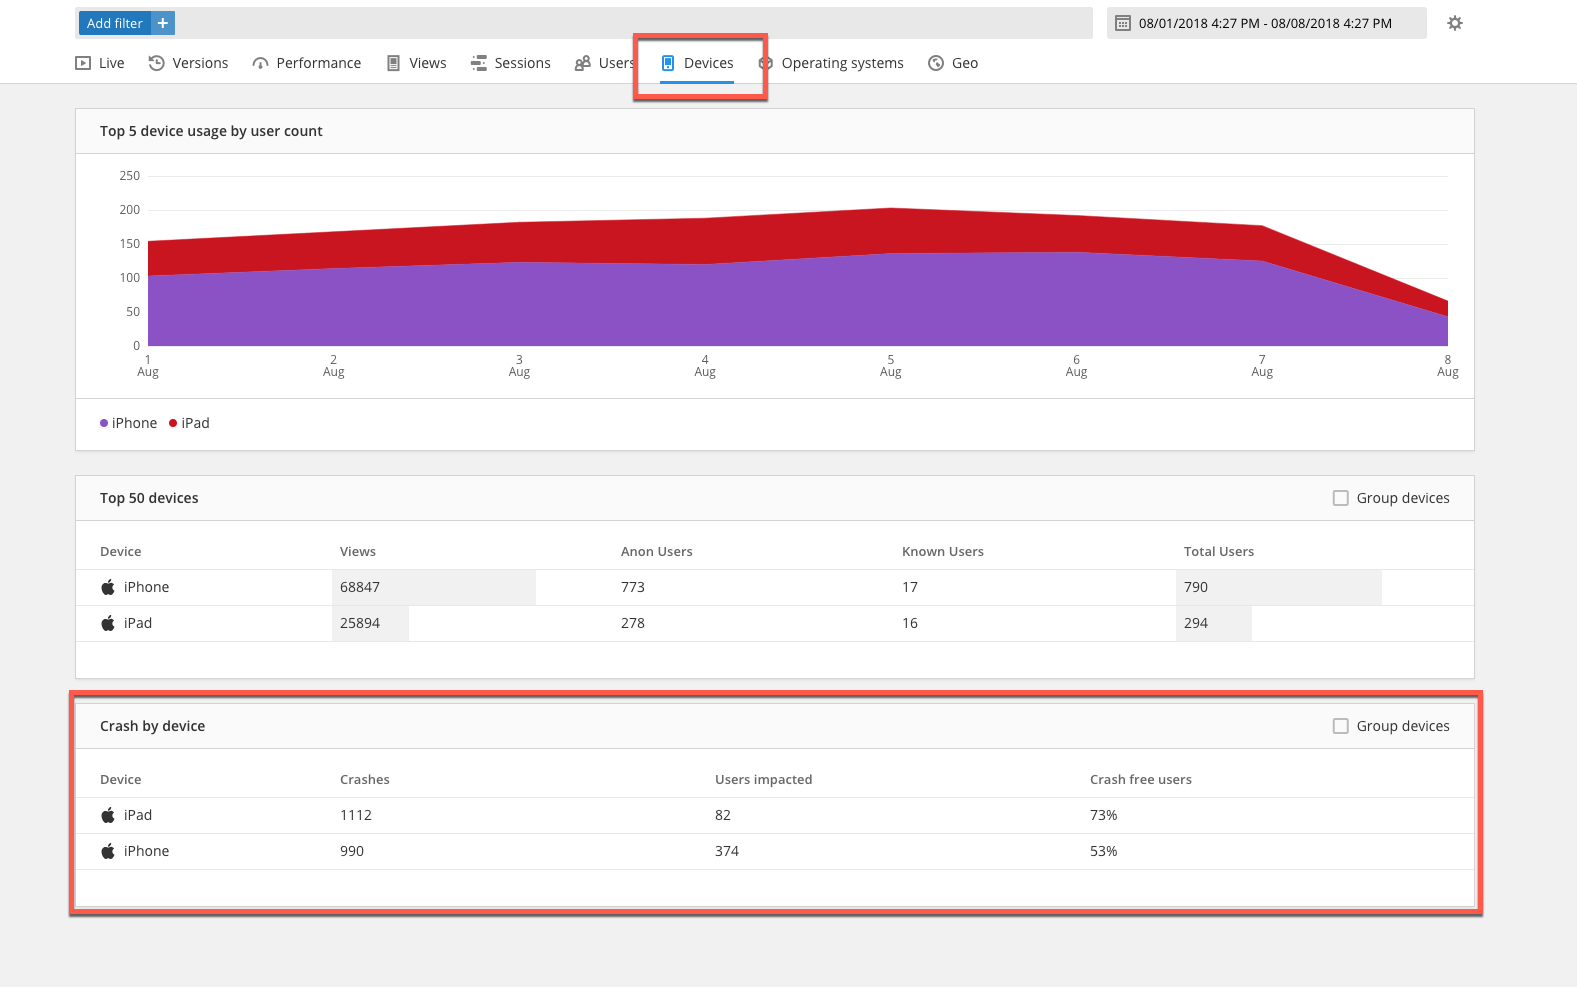
Clicking the ‘View in Real User Monitoring’ link will take you to the ‘Devices’ page in RUM for Mobile. You will see the new ‘Crash by device’ module.
Don’t see the ‘View in Real User Monitoring’ link? This just means you haven’t enabled RUM. Talk to our sales team to add RUM to your Crash Reporting plan.
Real User Monitoring
To access the Crash by device breakdown in Real User Monitoring, navigate to the ‘Devices’ page in RUM for mobile.

What can I do with the data?
Here are a handful of ideas for ways to use the Crash by device breakdown:
-
You need to know which devices cause the most errors.
-
Your team has just released support for a new operating system, and you need to know if it’s causing crashes.
-
Create a report over time which devices cause the most problems for your end-users.
-
You are debugging an application and need more context into which device caused an error.
-
If you have RUM, you can track the number of crashes per view.
Do you have any questions about the new device module or want to upgrade your plan? Talk to our sales team today.


