APM isn’t just for Ops: Shifting Left and supercharging your developers
Posted Jul 14, 2020 | 5 min. (885 words)When we were rethinking what an Application Performance Monitoring product could be, we did what we always did. We thought of developers, and the ultimate users that they serve.
It’s no surprise then that two years back, we built an all-new take on APM from scratch. One that armed developers with the level of insights that they need to deliver great software.
Fortunately, we seemed to be onto something here. The relics of the past are now starting to talk about “shifting left,” meaning “moving to the left on the SDLC,” meaning “empower the developers to get in earlier in the delivery to ensure a great outcome.”
Getting developers involved earlier is nearly always a huge positive. DevOps helped demonstrate that owning the delivery helped improve the quality of the outcomes. Having an APM that helps with this is just as important.
How a developer-friendly APM is different
1. It’s not just requests and database calls
I have huge respect for the older APM providers. They helped shine a light on issues and create a category. However, many were also designed and built more than a decade ago.
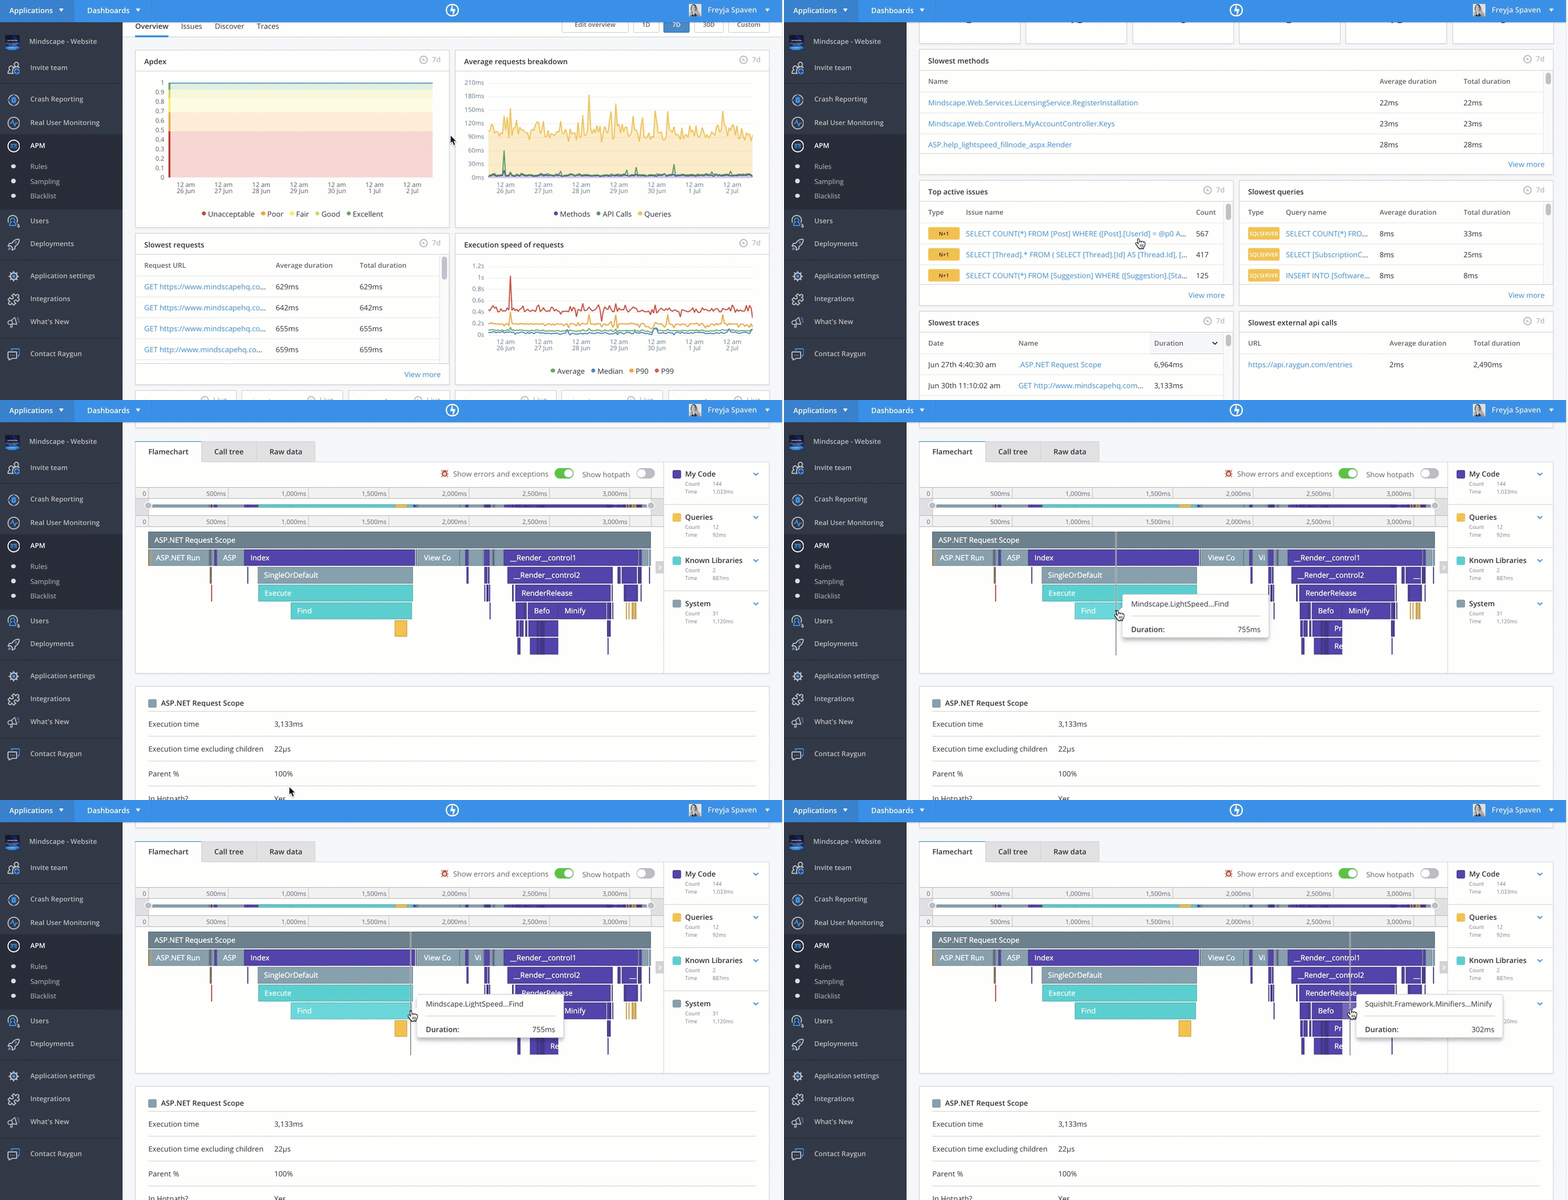
Raygun APM goes a level deeper. It includes method-level timings. That’s right, it’s like capturing full profiler traces on your requests. This is the stuff that developers need to identify poorly running code. Just having a single request and a database call is only a part of the picture for performance.
 Raygun APM reveals method-level timings.
2. Anti-pattern detection
We think of Raygun’s products as being like a virtual team member, helping your team deliver faster, better software for customers. That’s why we detect common mistakes that can be easily made when developing software.
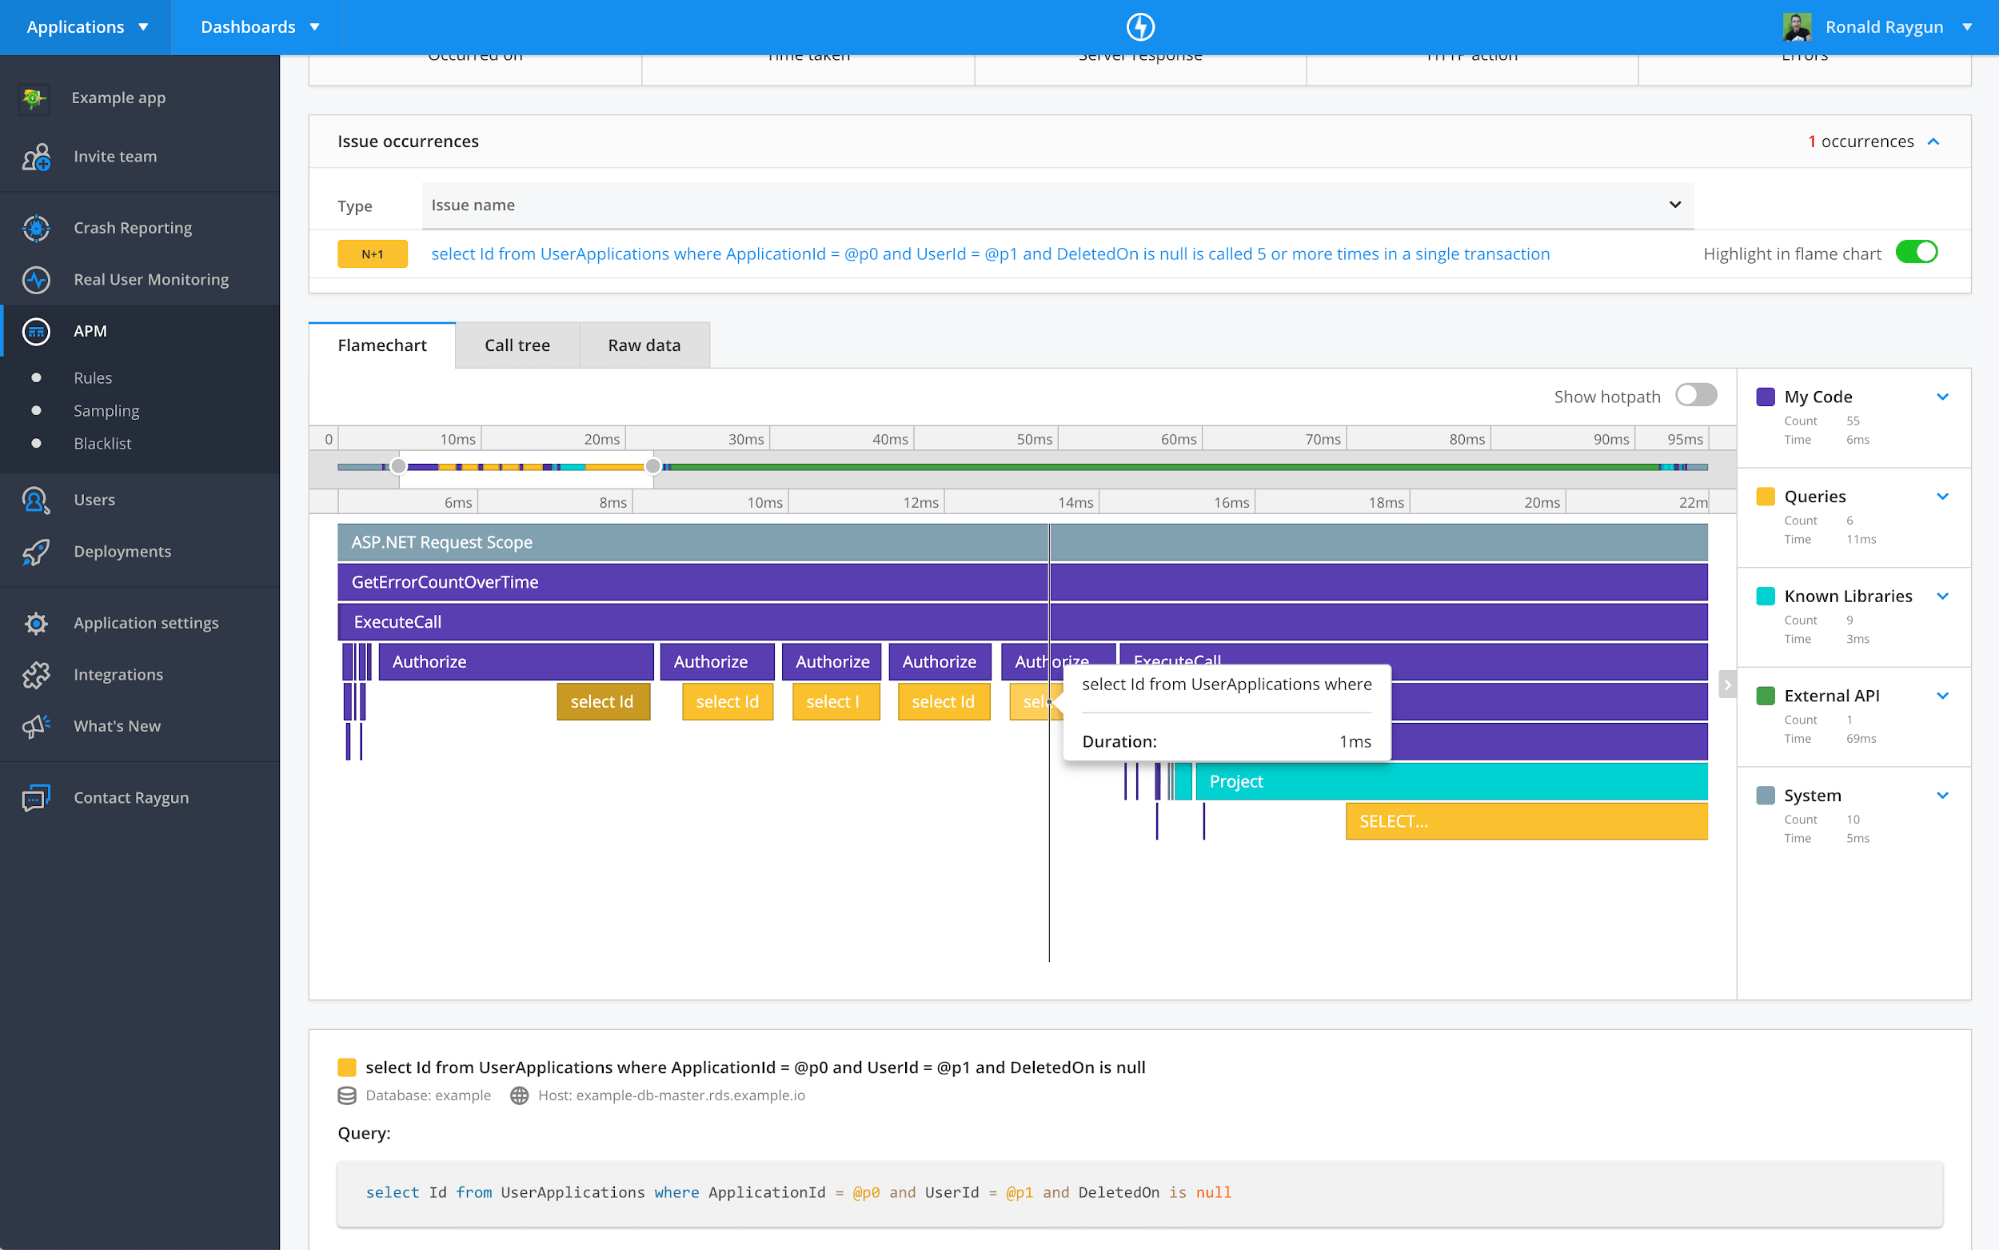
A good example is that of N+1 queries. This is a situation where you inadvertently make many database calls when 1 would be sufficient, and faster. An example might be a shopping cart, where you load the cart (+1), then fetch each item individually (n). But fetching it in one call goes faster.
Raygun APM detects these call patterns and creates issues for you to resolve, helping your team keep the software humming well, even in development.
 Raygun APM surfaces N+1 queries.
3. Issues!
Many existing APM solutions have really beautiful charts. So do we, for that matter.
However, you often see people trying to interpret the charts to find issues. There has to be a better way, and there is.
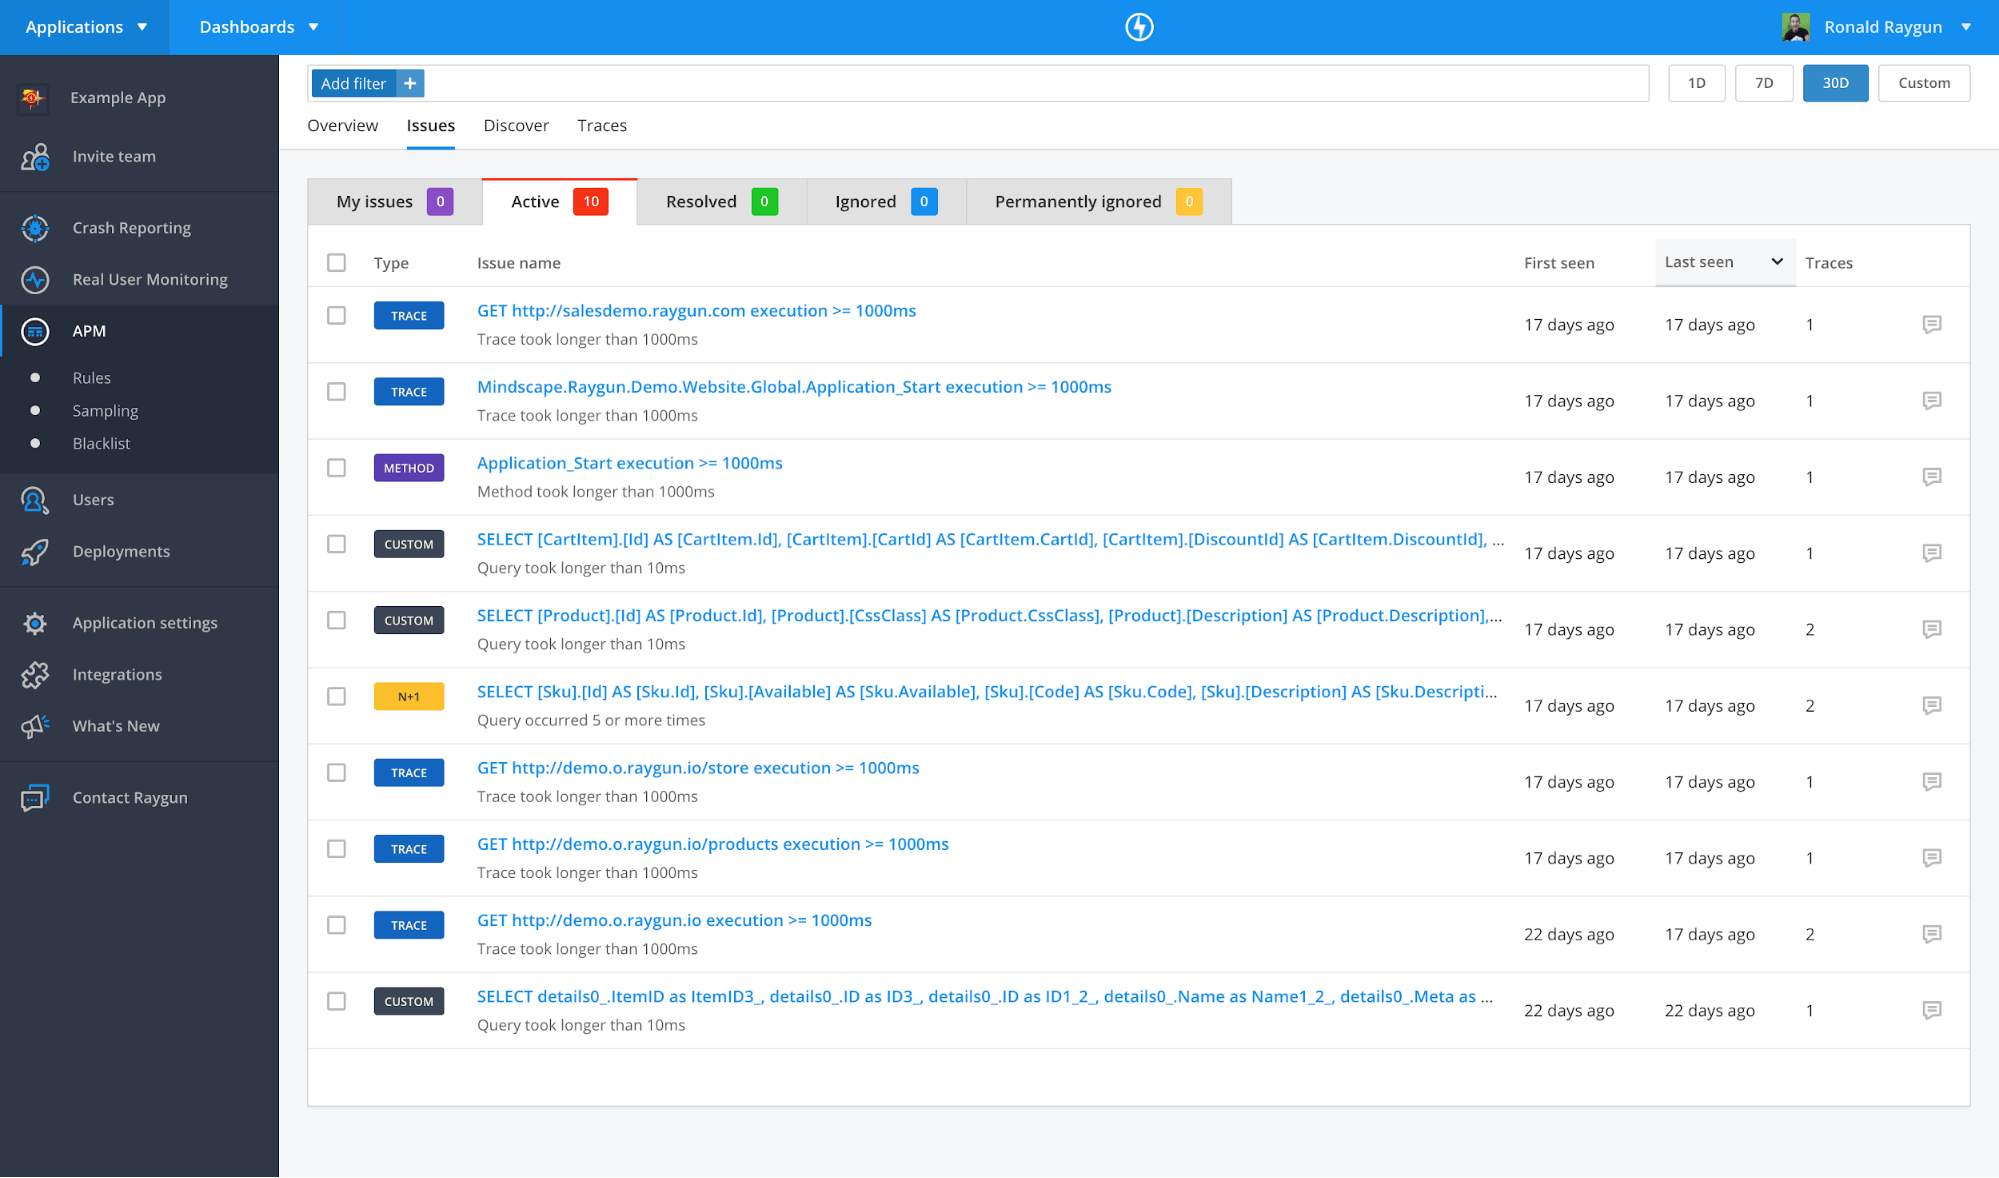
Off the success of Raygun Crash Reporting, we knew teams liked having work items and a workflow. So we brought that functionality over to Raygun APM, which detects issues and creates an item and event count based on how often that issue occurs so you can track patterns. You can even lift them up into your issue tracker, like Jira, with our built-in integrations.
Furthermore, we included our light-weight workflow engine. You may have issues that are by design (Raygun product rule: don’t assume you know more than the user!) and want to permanently ignore them. You want to flag when they’re resolved and clear off the list — those sorts of things.
 The Active issues page UI in Raygun APM makes it easy to prioritize active issues.
4. Easy cost controls
We dropped the archaic ‘per server pricing model’ and instead price on traces captured. This directly relates to our costs and aligns us better with our customers to deliver value.
Of course, capturing all requests can be too much — both in terms of noise, but also perhaps cost. But what about when you’re fighting a fire in production and need everything you can get?
We thought about this and provided sampling controls directly within our web application. You can dial up to capture everything, or dial it back. The various agents will update from the web app frequently so you can easily capture everything when you need it, and dial it back when you’re done.
5. Smarter sampling
We’d heard from many frustrated customers of existing APM solutions. One of the biggest bugbears was when there was a particular page they wanted to capture a trace from. Some APM tools let you do a deeper dive every now and then, while Raygun APM does it always (see #1).
However, the issue is when the sampling is done at a per-request level. If you’re trying to capture deeper traces and it’s sampling 1/1000 — how could you ever get the one for the page you care about?
Good news: Raygun’s sampling can be done on a per-URL basis. You may decide you want to capture all traces from a given URL, but sample the rest, or vice versa.
This customization really empowers development teams to understand the health of their software.
Wrapping up
I’ve highlighted just five of the ways that Raygun APM is the developer’s choice for an APM solution. It integrates beautifully with our Crash Reporting and Real User Monitoring products too. You can literally find a user, trace their front-end performance, back-end performance, and errors they may encounter — down to the exact method calls, all within Raygun.
We provide a free 14-day trial, one we’re happy to extend if you’ll chat with us about how you’re going. Experience the fresh air of a modern APM solution that’s helping developers deliver better code, faster, for your customers.


