Diagnose slow page requests with the latest addition to RUM
Posted Jun 3, 2020 | 2 min. (360 words)Earlier in the year, we launched the request details page in Raygun Real User Monitoring. This update brought the instance-level insights into page performance to help you understand exactly what caused poor performance and how to improve it.
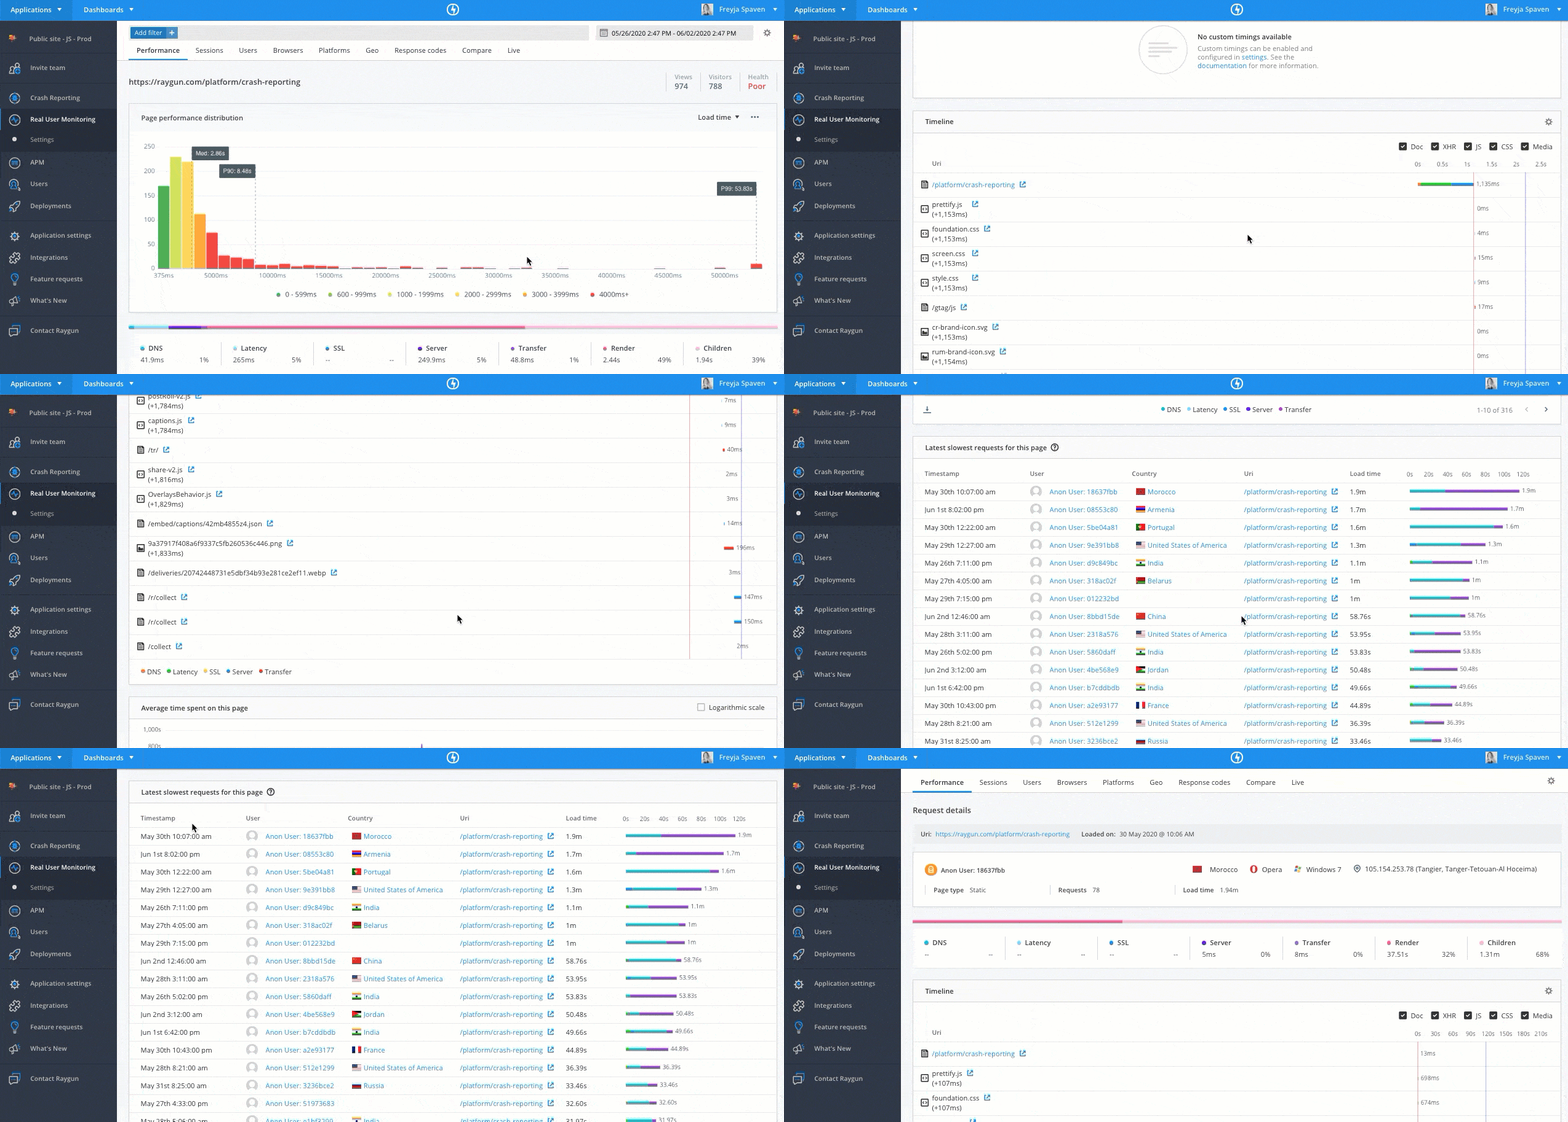
To complement instance-level insights, this latest launch brings the Latest slowest requests module to Real User Monitoring. Now, when viewing performance data for a specific URI, you can easily jump into the instance-level diagnostics for a specific slow request.
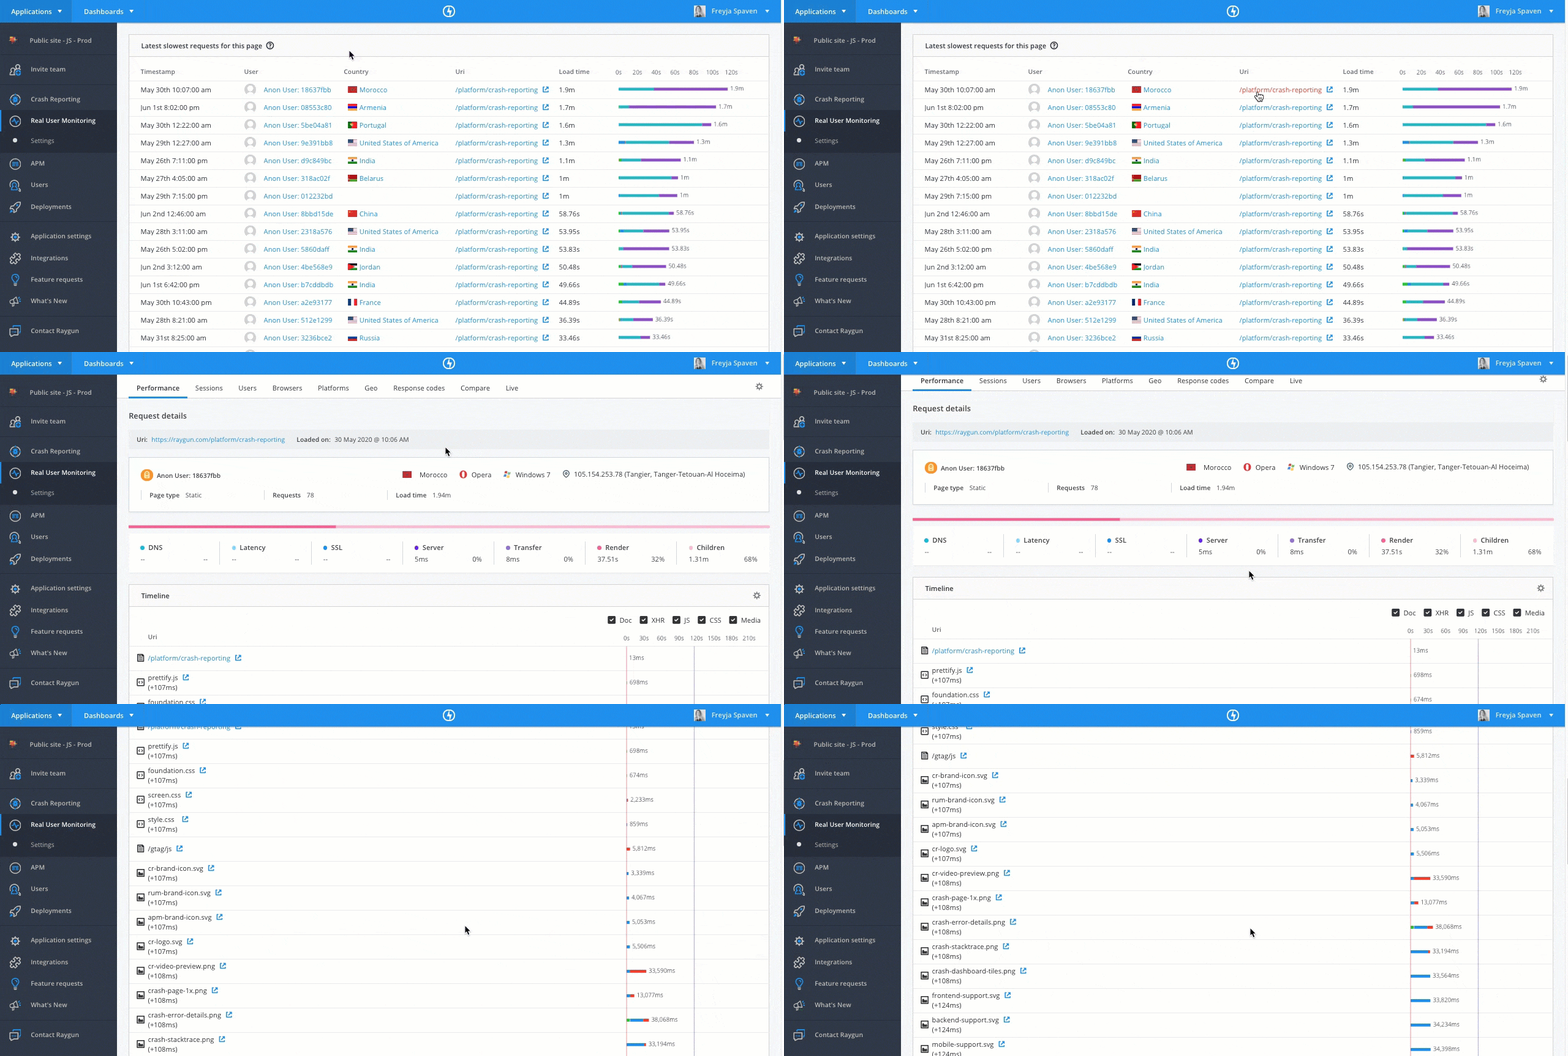
Simply click into the URI from the slowest requests module. From there, you’re presented with instance-level diagnostics for that specific request, including:
- Key contextual information about the request, like the geography, browser, device, and operating system.
- The load time breakdown of this page, showing you how much time was attributed to the different portions of load time (network, server time, client time).
- The waterfall timeline, showing you all requests made to load that page, and the load time of each.
- A list of XHR calls made from that page, and the response time of each.
Now, it’s both easier and faster to debug slow page requests that could be impacting performance. The slowest requests module also works with the top-level filters, so you can easily find the slowest requests from a particular browser, location, device type, and more.
Where to find the slowest requests module
If you’re a Raygun RUM customer, there’s no need to do anything. From the main performance page, drill into the performance diagnostics for a specific URI and you’ll find the new module at the bottom of the page.
This latest module addition to RUM is part of a body of work here at Raygun to make diagnosing application performance problems easier than ever. We’ve recently added user-centric performance metrics like first paint, response codes support, and plenty of UI improvements, all so you can measurably improve the performance of your applications.
Not a Raygun Real User Monitoring customer yet? Sign up for a free trial and start monitoring your application performance right away.
Or, do you have feedback about the new features? We’d love to hear from you. Just get in touch and we’ll be happy to help.
