Raygun’s best features: Which out of the box features could you be missing out on?
Posted Feb 14, 2017 | 9 min. (1772 words)The Raygun Software Intelligence Platform is designed to fundamentally change your error management process, making it easier and quicker for your software team to find and solve errors. To do this, we have built some very powerful features that allow you to add process to your error management, and understand your end users better than ever.
What you may not realize is that some of Raygun’s best features are available out of the box, whether you are just trying the Raygun Software Intelligence Platform for the first time on a free trial, or are a valued customer.
Are you taking advantage of these features and getting the most from your account? Here’s a quick checklist:
- User tracking
- Session tracking
- Deployment tracking
- Inbound filters
- Breadcrumbs
- Dashboards
- Insights
- Bonus to Business and Enterprise customers: Reports
- APM
If you see any features that you aren’t using, read on. You’ll be fighting bugs and making your end users fall in love with your application in no time.
1. User Tracking: Give better customer service than your competitors
At the end of the day, your application users are real people. When tracking errors, it’s easy to see just that; a number of people affected or amount of errors that occurred in a day. Raygun’s User Tracking feature makes that missing connection between error and end user for you. (You can prevent Raygun from collecting customer information to comply with internal policies.)
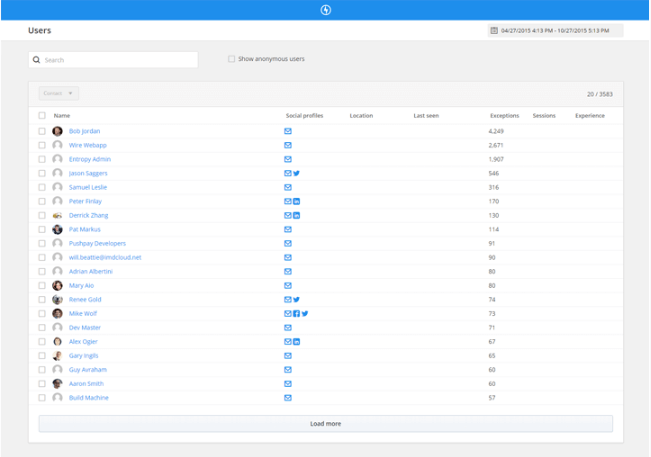
With the Raygun Platform, you can:
-
Get a full list of affected end users who have experienced crashes and errors with your application
-
See when and why errors happened, plus the information you need to fix the issues before further end users are affected
-
No one ever sends an error report. Take a proactive approach and delight your customers with a notification to say that you saw they experienced a problem and you have deployed a fix. Perhaps even offer a discount voucher or incentive to apologize.
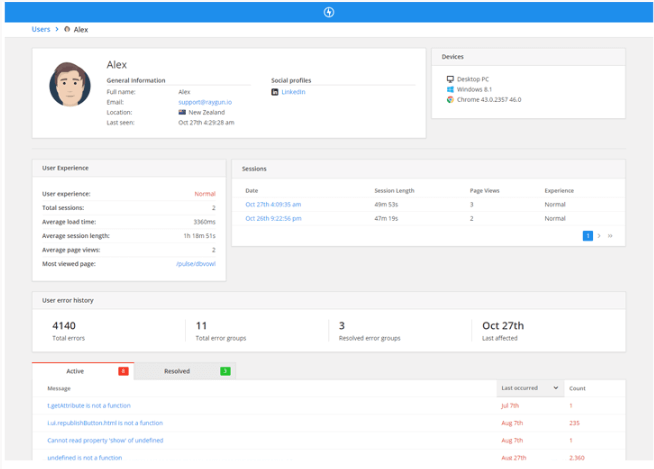
This simple yet powerful feature allows you to deliver a better customer experience than your competitors by just knowing more about your end users.
Find out more about User Tracking
2. Session tracking: Understand a specific user’s application setting
To understand how your end users are navigating your applications, session tracking gives a rich and holistic view of a user’s specific application session. This is much more detailed and intuitive than trying to paint a picture from your web analytics platform.
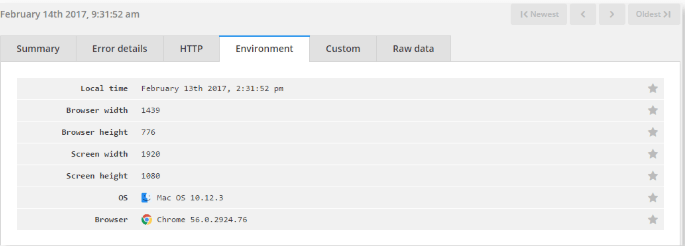
With Raygun’s Software Intelligence Platform, you’ll be able to dive into each individual session. With real time reporting, you can even see an individual session to watch it develop:
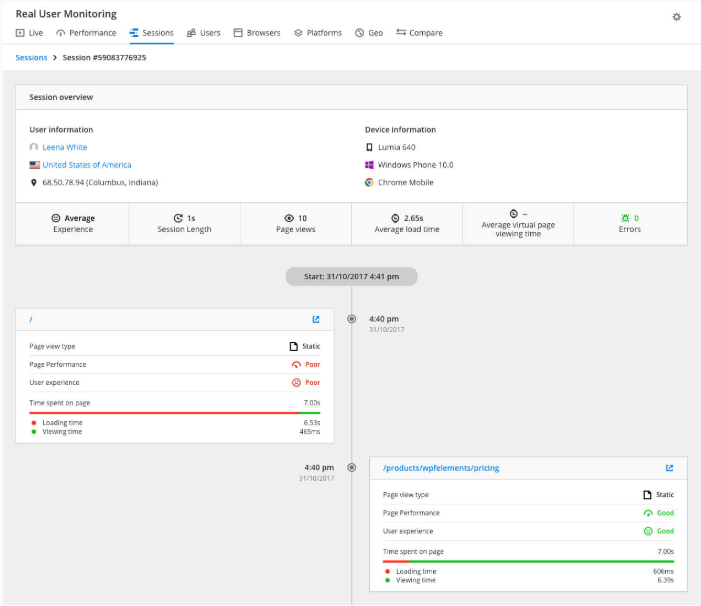
Being able to understand your customer experiences like this make all the difference to increased customer satisfaction (which often translates to more sales and better profits).
Sessions allow you to see what the user actually experienced.
Inside the Sessions tab, you’ll find metadata about an individual user’s actual session including environment data (OS, browser and device type). This is really important to discover re-occurring issues with particular environments and keeping a clean codebase. (For example, removing needless code for unsupported browsers not only reduces the file size, but helps increase the maintainability of the codebase.)
Timing information included when tracking sessions also gives details on average load time, error count, (platform only) and a measure of load times for each page visited.
In short, Session tracking helps make more informed decisions based on what your end users and ultimately customers want.
3. Deployment tracking: Find problematic deployments
In a survey on DevOps and continuous delivery, the deployment process was the biggest pain point for 29% of software professionals using the continuous delivery model. It doesn’t have to be this way. Use the deployment tracking feature to create a reliable workflow surrounding errors and deployments.
Raygun’s deployment tracking gives you the peace of mind that problematic deployments are picked up immediately, including the commits that made them. In fact, Raygun uses this feature to track deployments and triage errors when we deploy any code. We use the continuous deployment model and deploy safely and efficiently six times a day.
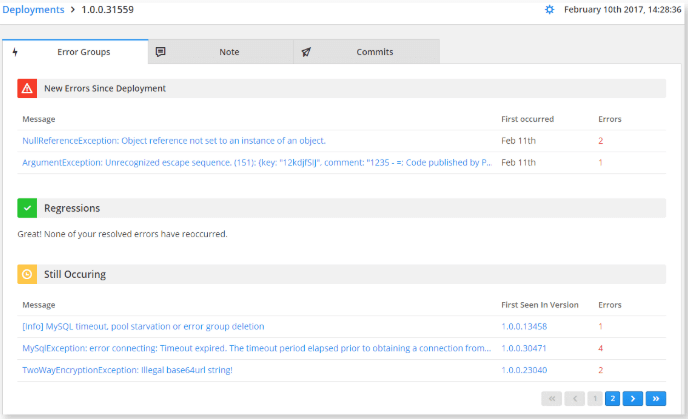
Deployment tracking takes the pain out of deployments and lets you identify:
- Which errors have been introduced with the new release
- Which errors are still occurring
- Errors that have been fixed
- Previously resolved errors that have reoccurred
Ship with the confidence that any errors will be found well before your end users experience them.
Find out more about Deployment tracking
4. Inbound Filters: Prioritize errors quickly
You may have an active triage and error resolution process in place. Once the errors start arriving in Raygun’s main dashboard, you may notice there is a commonality to the errors that are not relevant to your system. Rather than ignoring these errors on a case by case basis, we created a set of rules which are used to decide if Raygun should continue to process the error, or simply discard it.
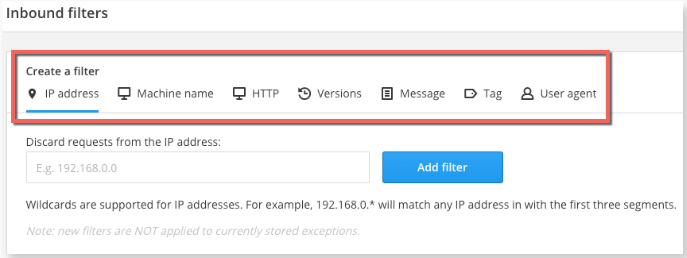
Raygun allows you to toggle the following inbound error filters on and off as needed:
- IP address
- Machine name
- HTTP hostname
- Versions (including ‘no specific version’)
- Message
- Tag
- User agent
We highly suggest you make use of the Inbound Filters feature which will help to reduce any noise. In fact, using the Inbound Filters at regular intervals will help you avoid disregarding errors that are important.
Find out more about Inbound Filters
5. Breadcrumbs: Attach an accurate trail of the events through your system leading to a crash
Using the Breadcrumbs feature you can attach a trail of events that happened to a particular user leading to the moment a crash report was generated.
This handy feature allows you to gain more insight into exactly why your application crashed when it did. We have made it really easy to prioritize your errors using a colour coded icon system:
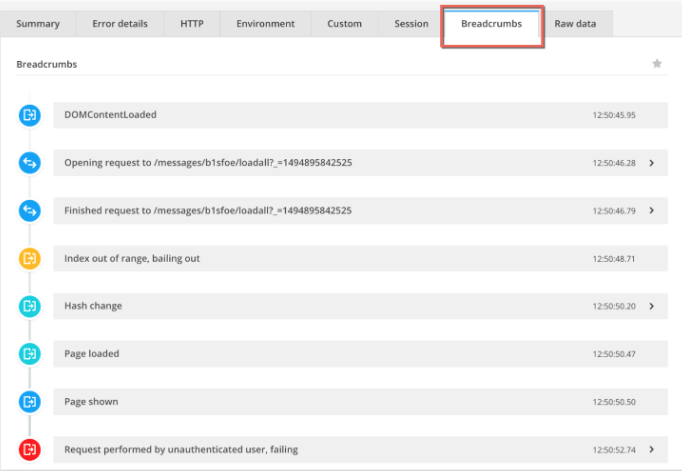
Important behaviours stand out at a glance, so it’s easy which errors will be important to fix first:
- Blue icon = debug
- Teal icon = info
- Yellow icon = warning
- Red icon = error
Some of the key uses for the Breadcrumbs feature can be tagging key service object calls, along with their return values. Another is your interactions with third party APIs and their responses to give you a better understanding of where problems may have occurred in your external integrations.
Find out more about Breadcrumbs
6. Dashboards: Organize your data to spot problems quickly
The Dashboard feature will help you get a better understanding of your software health, from errors and crashes to performance problems affecting your end users. The Dashboard was designed with an easy to use interface at the front of mind:
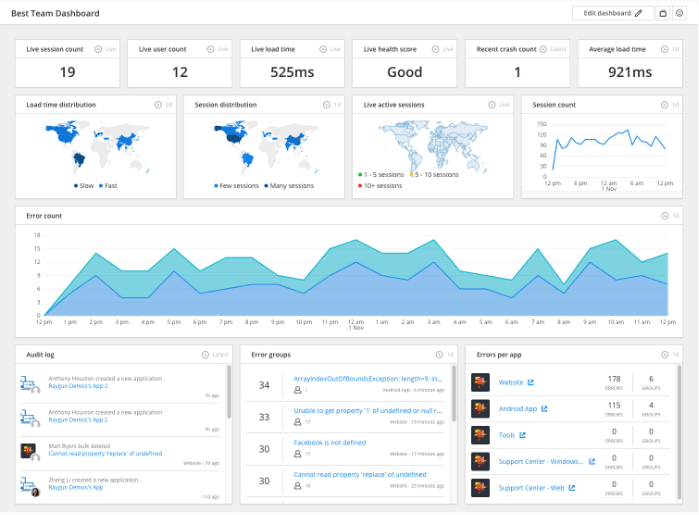
Tiles are the most important part of the dashboard, and play a key part of your software data visualization. Each one is fully customizable, and can be dragged and dropped into any arrangement you see fit, for example, an arrangement that shows a non-technical person application performance. Enterprise customers can also create multiple dashboards so you can toggle through KPIs.
Find out more about Dashboards
7. Insights: Understand and prioritize performance issues affecting end users
Insights is a powerful addition to our Real User Monitoring software, and certainly stands out as one of Raygun’s best features.
Usually, to assess whether a page has a good page load speed, industry standard is to pass the individual pages through a page load speed tester. Examples are Yahoo’s YSlow or Google PageSpeed tools

Not very efficient for a modern software development team with potentially thousands of pages to test. Enter Insights, which, instead of measuring page performance of single pages, assesses your whole website.
Insights is also more comprehensive, passing every page through a set of 20 usability and performance rules. These rules check resources on each page and come back with actionable feedback to speed up and enhance user experience.
What surprised us about this feature was that people emailed us to let us know they were able to fix issues they didn’t know existed. [When we used Insights on our own website,][11] we got the details we needed to increase page load speed by 38% per page, which we fixed in less than a day with one engineer.
See where your performance issues lie and which users they are affecting with Insights.
8. Reports: Construct reports based on the data and criteria that you’d like to see and segment (bonus feature for Business and Enterprise customers)
Raygun has always held customizable data as a high priority when catering for Business and Enterprise plans. While other crash reporting solutions sample or replicate data when they see recurring errors, Raygun stores every single error occurrence. We understand each error holds unique details that help fix errors a lot faster, and missed details add up in lost revenue.
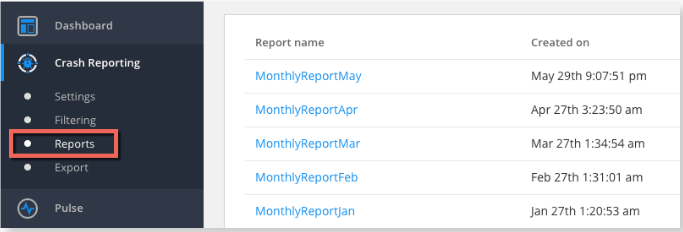
With Raygun, all the data is available at your fingertips. The Reports feature allows you to segment this data according to your own specific rule set:
- Extract, surface and compare custom data and fields from the error payload
- Analyze errors in more detail by applying primary and secondary filters
- Download reports as CSVs for further data analysis outside of Raygun
- Generate reports at a frequency that suits your reporting needs
Get the flexibility to start constructing your very own reports based on only the data you need.
9. APM: Get greater context into performance issues with Application Performance Monitoring
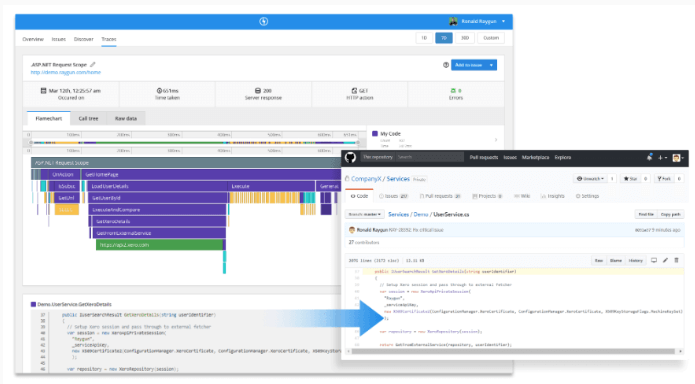
Raygun APM provides server-side application performance monitoring. APM allows you to measure the timings of everything that is going on whilst the page is trying to load, and discover bottlenecks that are slowing it down.
APM tools help your development team identify common application problems quickly:
-
Understand and drill down into the root-cause of any application issue immediately, including the exact line of code, function, database, or API call that are causing issues
-
Understand and compare the impact of your deployments on critical metrics such as changes to the Apdex scores, new errors introduced, regressed errors, and impact on performance
-
Track overall usage to help understand traffic spikes
Are you missing out on any of Raygun’s best features?
These features are among our most powerful, yet they are just the tip of the iceberg. The Raygun Software Intelligence Platform gives your software team the power to create perfect software experiences when used to its full advantage. The best part is, these powerful features are available straight out of the box to all plans. They take less time to set up than a coffee break!
Do you have any questions around how to use Raygun’s best features? Contact a friendly team member here.