Enter your details to view and download the full PDF version

Knowing your tools can make a significant difference when it comes to getting things done. Despite JavaScript's reputation as being difficult to debug, if you keep a couple of tricks up your sleeve errors and bugs will take less time to resolve.
We've put together a list of 16 debugging tips that you may not know, but might want to keep in mind for next time you find yourself needing to debug your JavaScript code!
Most of these tips are for Chrome and Firefox, although many will also work with other inspectors.
After console.log, debugger is my favorite quick and dirty debugging tool. If you place a debugger; line in your code, Chrome will automatically stop there when executing. You can even wrap it in conditionals, so it only runs when you need it.
Sometimes, you have a complex set of objects that you want to view. You can either console.log them and scroll through the list, or break out the console.table helper. It makes it easier to see what you’re dealing with!
Will output:

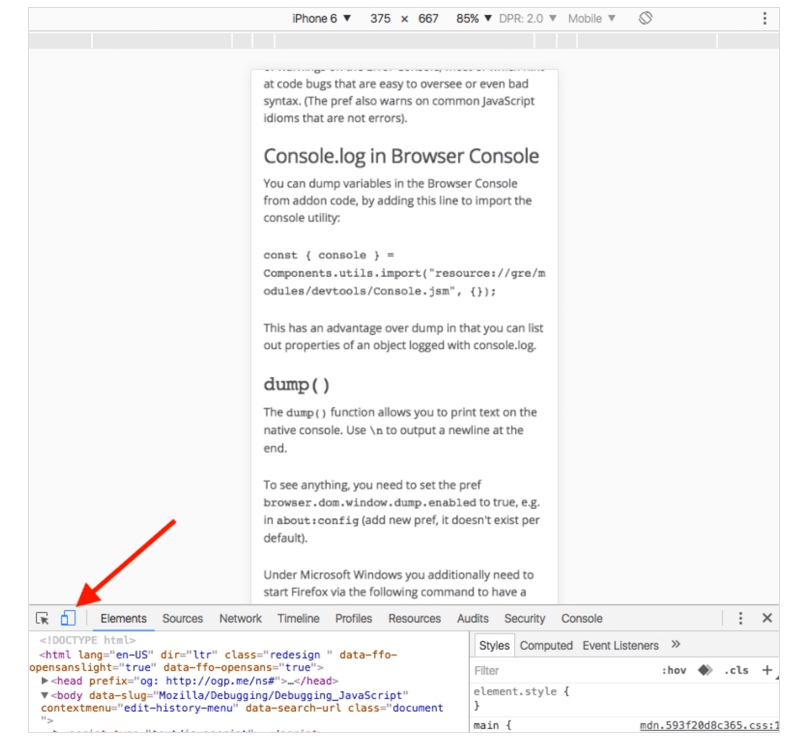
While having every single mobile device on your desk would be awesome, it’s not feasible in the real world. How about resizing your viewport instead? Chrome provides you with everything you need. Jump into your inspector and click the toggle device mode button. Watch your media queries come to life!
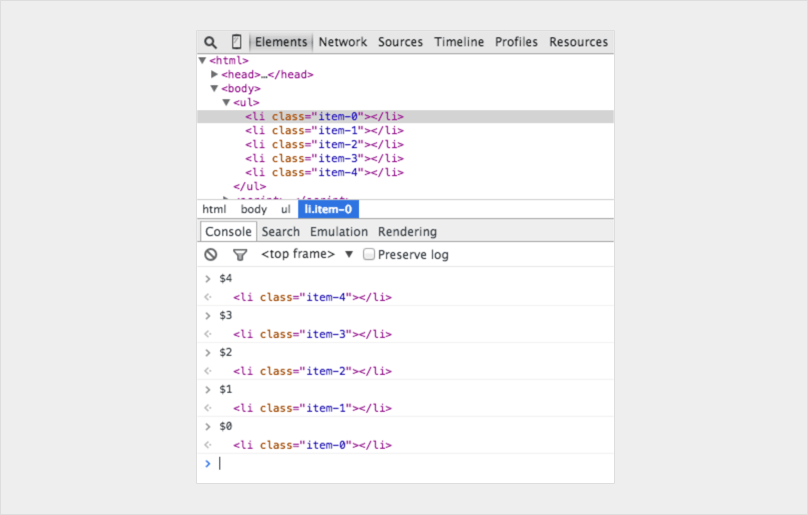
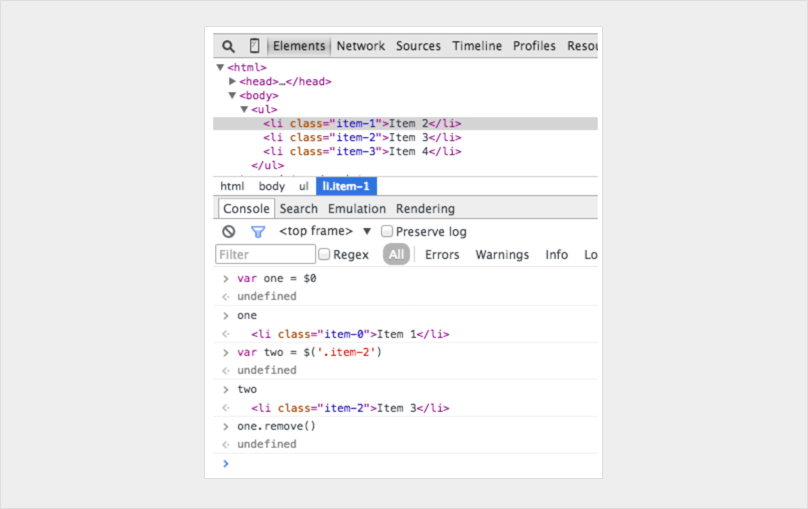
Mark a DOM element in the elements panel and use it in your console. Chrome Inspector keeps the last five elements in its history so that the final marked element displays with $0, the second to last marked element $1 and so on. If you mark following items in order ‘item-4′, ‘item-3’, ‘item-2’, ‘item-1’, ‘item-0’ then you can access the DOM nodes like this in the console:
It can be super useful to know exactly how long something has taken to execute, especially when debugging slow loops. You can even set up multiple timers by assigning a label to the method. Let’s see how it works:
Will output:

You probably know JavaScript frameworks produce a lot of code – quickly.
You will have a lot of views and be triggering a lot of events, so eventually you will come across a situation where you want to know what caused a particular function call. Since JavaScript is not a very structured language, it can sometimes be hard to get an overview of what happened and when. This is when console.trace (or just trace in the console) comes in handy to be able to debug JavaScript. Imagine you want to see the entire stack trace for the function call funcZ in the car instance on Line 33:
Line 33 will output:
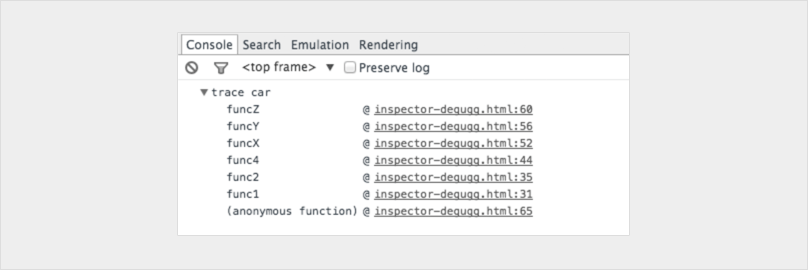
Now we can see that func1 called func2, which called func4. Func4 then created an instance of Car and then called the function car.funcX, and so on. Even though you think you know your script well this can still be quite handy. Let’s say you want to improve your code. Get the trace and your great list of all related functions. Every single one is clickable, and you can now go back and forth between them. It’s like a menu just for you.
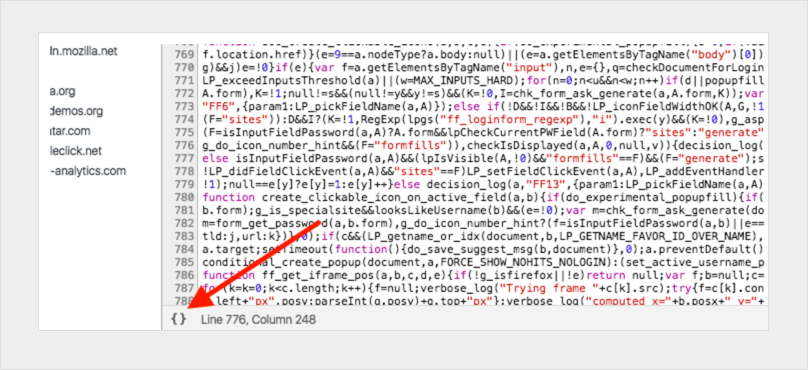
Sometimes you may have an issue in production, and your source maps didn’t quite make it to the server. Fear not. Chrome can unminify your Javascript files to a more human-readable format. The code won’t be as helpful as your real code – but at the very least you can see what’s happening. Click the {} Pretty Print button below the source viewer in the inspector.
Let’s say you want to set a breakpoint in a function.The two most common ways to do that are:
1. Find the line in your inspector and add a breakpoint
2. Add a debugger in your script
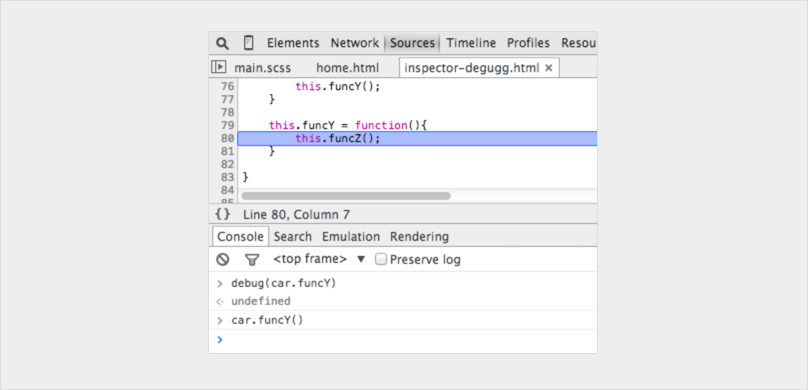
In both of these solutions, you have to navigate manually around in your files to isolate the particular line you want to debug. What’s probably less common is to use the console. Use debug(funcName) in the console and the script will stop when it reaches the function you passed in.
It’s quick, but the downside is that it doesn’t work on private or anonymous functions. Otherwise, it’s probably the fastest way to find a function to debug. (Note: there’s a function called console.debug which is not the same thing, despite the similar naming.)
Type debug(car.funcY) in the console and the script will stop in debug mode when it gets a function call to car.funcY:
Today we often have a few libraries and frameworks on our web apps. Most of them are well tested and relatively bug-free. But, the debugger still steps into all the files that have no relevance for this debugging task. The solution is to black box the script you don’t need to debug. This could also include your own scripts. Read more about debugging black box in this article.
In more complex debugging we sometimes want to output many lines. One thing you can do to keep a better structure of your outputs is to use more console functions, for example, console.log, console.debug, console.warn, console.info, console.error and so on. You can then filter them in your inspector. Sometimes this is not really what you want when you need to debug JavaScript. You can get creative and style your messages, if you so choose. Use CSS and make your own structured console messages when you want to debug JavaScript:
Will output:

In the console.log() you can set %s for a string, %i for integers and %c for custom style. You can probably find better ways to use these styles. If you use a single page framework, you might want to have one style for view messages and another for models, collections, controllers and so on.
In the Chrome console, you can keep an eye on specific functions. Every time the function is called, it will be logged with the values that it was passed in.
Will output:

This is a great way to see which arguments are passed into a function. Ideally, the console could tell how many arguments to expect, but it cannot. In the above example, func1 expects three arguments, but only two are passed in. If that’s not handled in the code it could lead to a possible bug.
A faster way to do a querySelector in the console is with the dollar sign. $(‘css-selector’) will return the first match of CSS selector. $$(‘css-selector’) will return all of them. If you are using an element more than once, it’s worth saving it as a variable.
Many developers are using Postman to play around with Ajax requests. Postman is excellent, but it can be a bit annoying to open up a new browser window, write new request objects and then test them.
Sometimes it’s easier to use your browser. When you do, you no longer need to worry about authentication cookies if you are sending to a password-secure page.
This is how you would edit and resend requests in Firefox. Open up the Inspector and go to the Network tab. Right-click on the desired request and choose Edit and Resend.
Now you can change anything you want. Change the header and edit your parameters and hit resend.
Below I present a request twice with different properties:

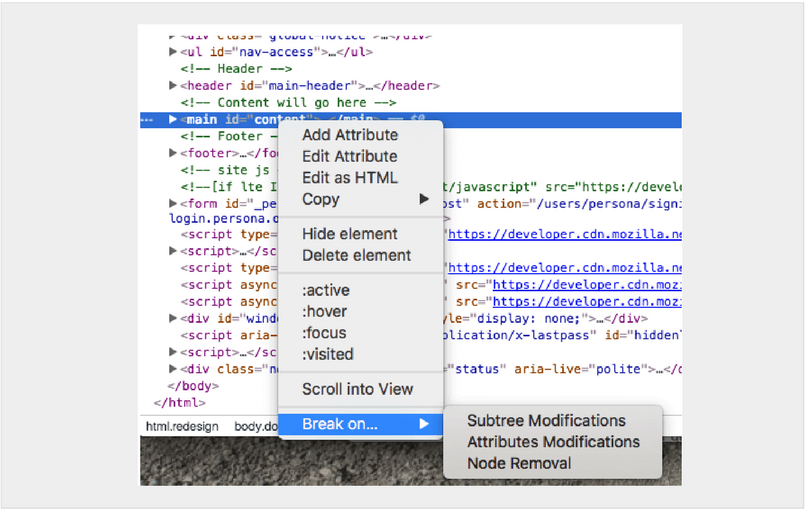
The DOM can be a funny thing. Sometimes things change and you don’t know why. However, when you need to debug JavaScript, Chrome lets you pause when a DOM element changes. You can even monitor its attributes. In Chrome Inspector, right-click on the element and pick a break on setting to use:
There are plenty of services and tools out there that can be used to audit your page’s JavaScript and help you to find slowdowns or problems. One of those tools is Raygun Real User Monitoring. This can be useful for other reasons beyond locating JavaScript problems — slow loading external scripts, unnecessary CSS, oversized images. It can help you to become aware of JavaScript issues that are causing unintentionally long loading times, or failing to execute properly.
You'll also be able to measure improvements in JavaScript performance and track them over time.
.png)
Lastly, the tried and true breakpoint can be a success. Try using breakpoints in different ways for different situations.
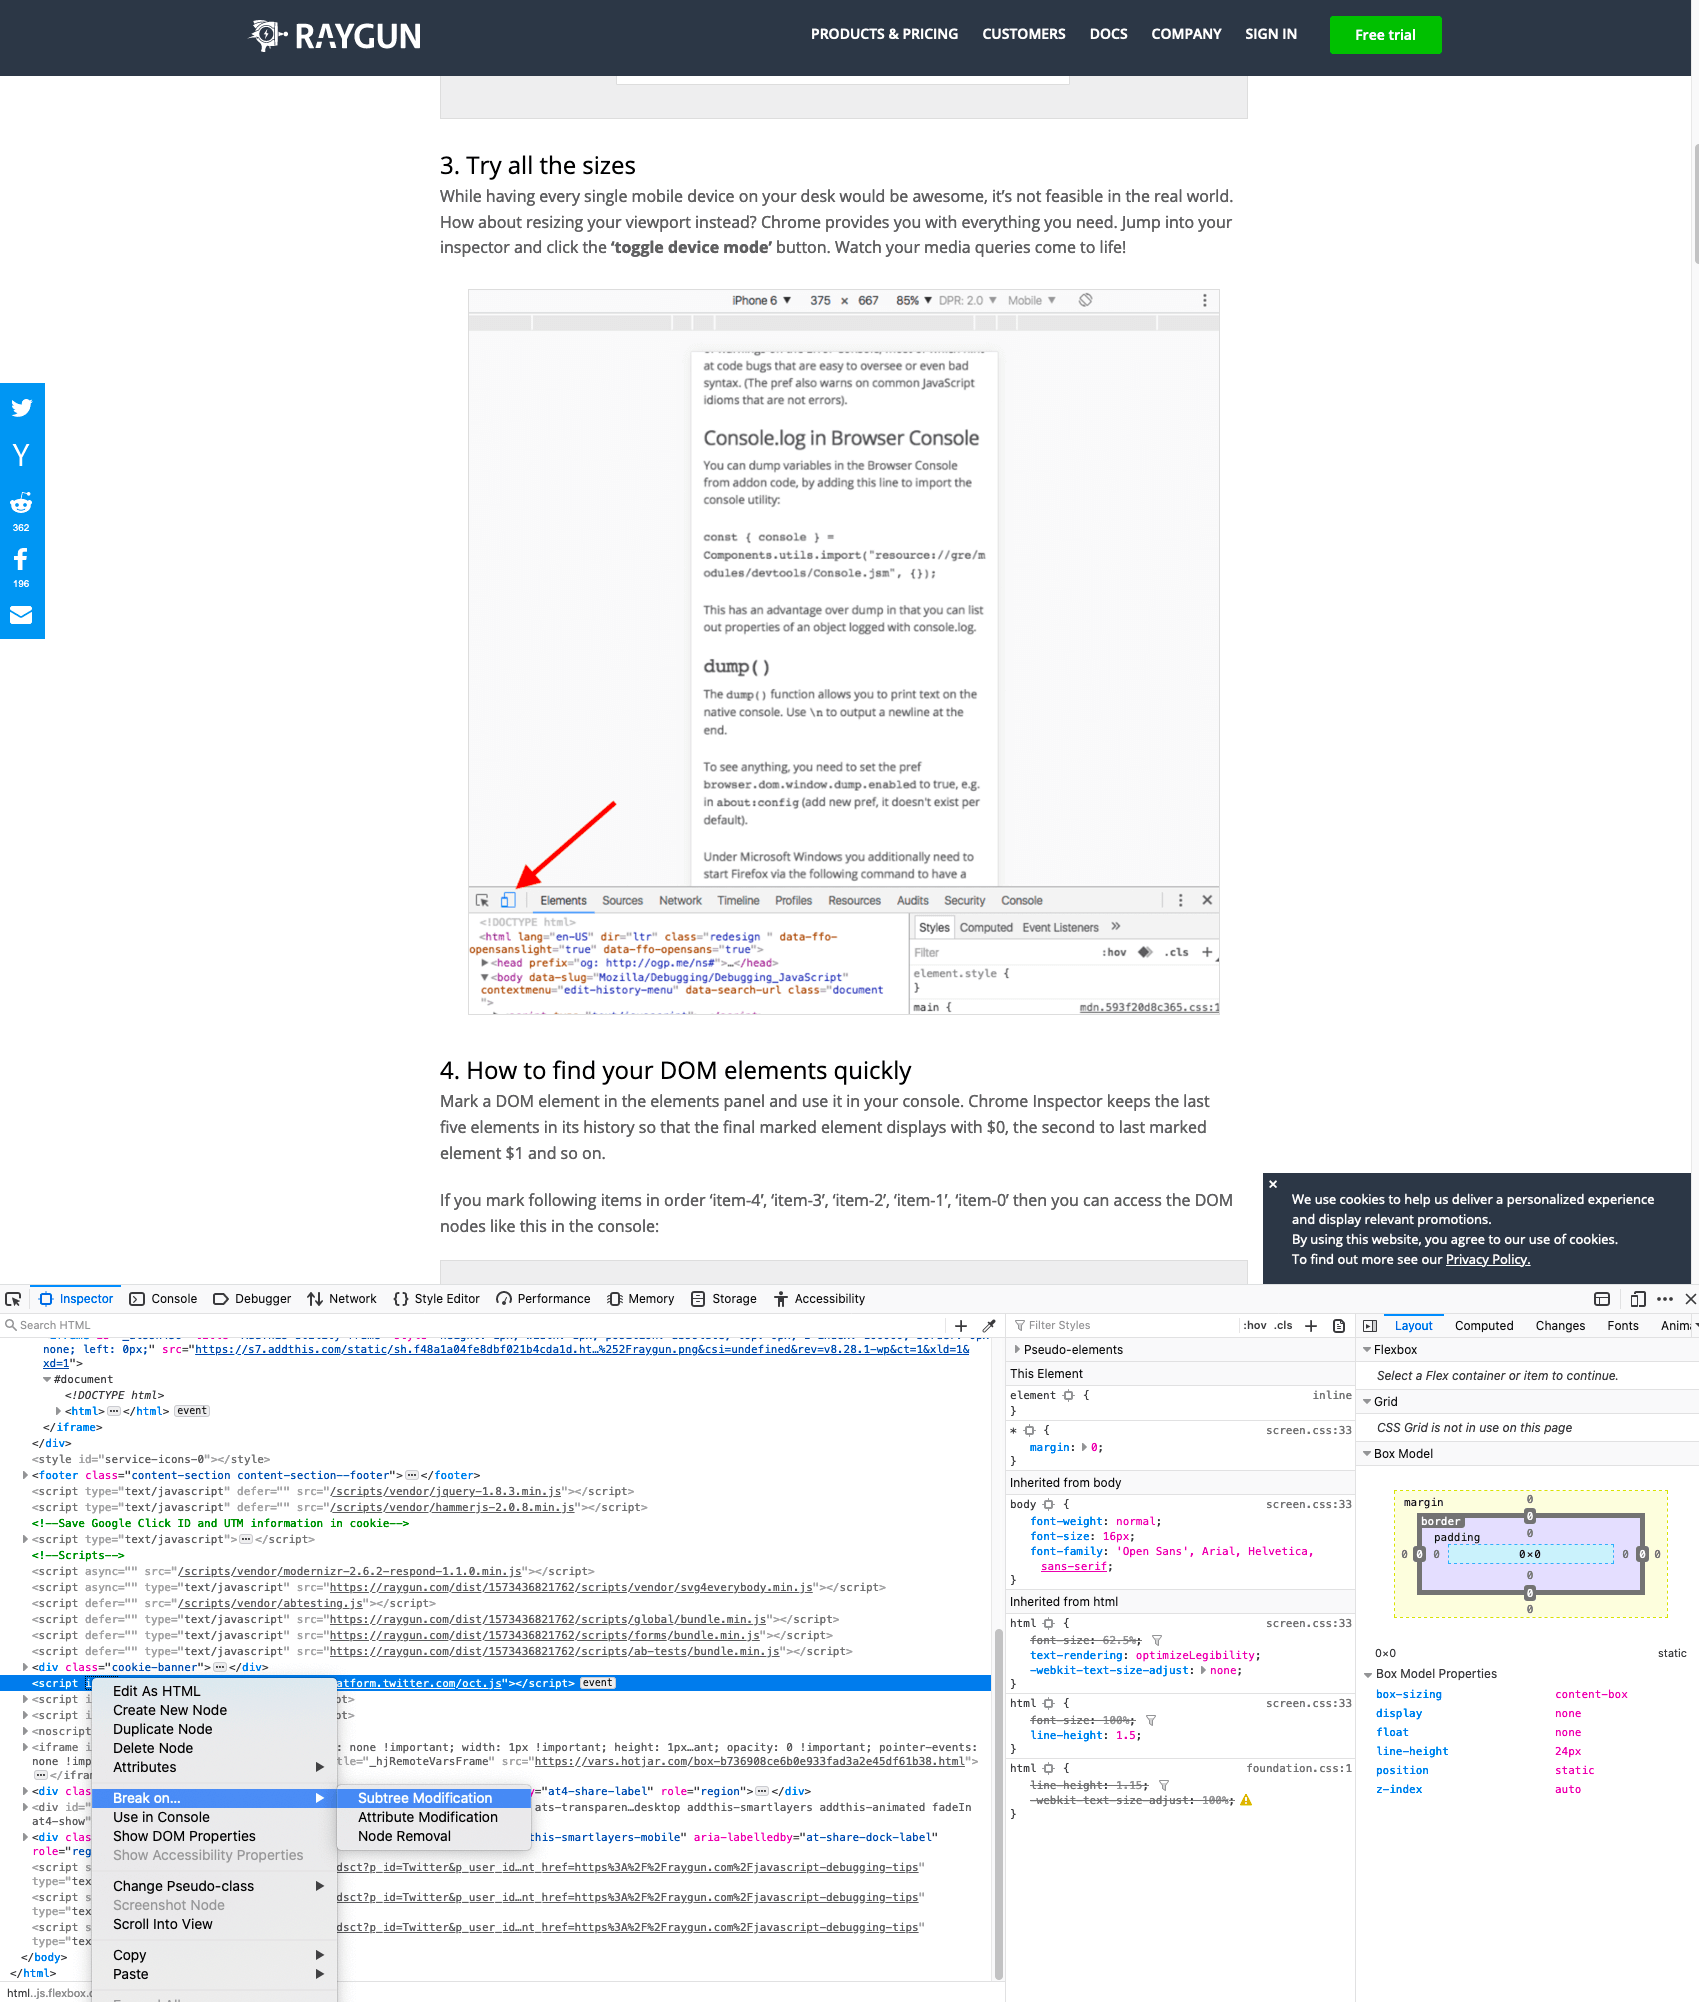
You can click on an element and set a breakpoint, to stop execution when a certain element gets modified. You can also go into the Debugger tab or Sources tab (depending on your browser) in your developer tools, and set XHR breakpoints for any specific source to stop on Ajax requests. In the same location, you can also have it pause your code execution when exceptions occur. You can use these various kinds of breakpoints in your browser tools to maximize your chances of finding a bug while not having to invest time in outside tool sets.
In summary, there are many ways to debug your JavaScript code. We’ve listed sixteen of them here. There is also a helpful article that lists JavaScript debugging tools, if you want to start looking at augmenting your browser tools with outside help. Either way, you should be able to use these tips to get your started debugging your JavaScript code and getting bug-free code ready to deploy and ship!
Raygun surfaces the diagnostic information you need to detect and diagnose JavaScript errors quickly. With support for all JavaScript frameworks and implemented with a few lines of code, you can start bashing bugs on your coffee break.
Take a free trial now and start monitoring in minutes.