Enter your details to view and download the full PDF version

User experience matters. Digital adoption has surged since the pandemic transformed everyday life, and while the market is growing at pace, customer expectations are sky-high and the competition is more cutthroat than ever.
Developers are on the front lines, having to deliver increasingly rich and complex digital experiences while trying to ensure everything is as frictionless as possible. With more metrics available than ever before, it has become increasingly difficult for developers to know where to focus their efforts for the greatest impact. Google has stepped in to provide an answer to that question, standardizing the user experience with three Core Web Vitals.
In this definitive guide, you’ll get best-practice advice, a proven workflow and actionable tips to start improving your Core Web Vitals and enhancing your end-user experience now.
(This guide is created with developers and engineering teams in mind. For an exec-level view of how Core Web Vitals impact business metrics, see our CTO's Guide to Core Web Vitals).
In 2020, Google first introduced Core Web Vitals as a subset of their well-established Web Vitals initiative to simplify the complex landscape of monitoring digital experiences. Each represents a distinct facet of the user experience: content loading speed, interactivity, and visual stability. In May 2021 these were officially implemented as a ranking factor in the Google Search algorithm. This creates elevated pressure on businesses to ensure they’re meeting the standard specified by Google, or risk losing organic placements, and in turn, diminishing business and revenue.
In the interests of ranking pages that provide consistent quality, Google has selected and defined three key measures of user experience:

The amount of time to render the largest content element visible in the viewport, from when the user requests the URL. The largest element is typically an image or video, or perhaps a large block-level text element.
This is important because it tells the reader that the URL is actually loading.

Does the page appear responsive (by painting a new frame) to user interactions like swipes or taps on a button? This measures the combined reaction time of all the interactions a user has with your page during their session. To get a “Good” score, the reaction time must be within 200ms on average. (Note that INP replaces the former interactivity metric, FID, from March 2024).
.png)
CLS measures the proportion of the viewport affected and the distance shifted for the largest burst of unexpected layout shifts across the entire lifespan of the page. This is important because page elements shifting without warning create a bad user experience.
The score ranges from zero upwards, where zero means no shifting and the larger the number, the more shifts on the page.
Core Web Vitals are your primary opportunity and your chief focus right now - but it’s important to view them as a component of a larger set of Web Vitals metrics. Google sees these other metrics as less critical to user experience, but they can still help with understanding and addressing Core Web Vitals issues and building a faster and higher-functioning site. You’ll encounter terms like First Contentful Paint (FCP) and Time to Interactive (TTI) while using testing and diagnostic tools, and these are relevant as supplementary measures of the speed and smoothness of your page.
If you've ever tried monitoring your Core Web Vitals on multiple tools, you may have noticed some variation in your scores. This is because the metrics are based on different datasets; synthetic/lab, CrUX, and Real User Monitoring (RUM), all of which serve a different purpose when monitoring and improving your scores. Let’s dive into what makes each source unique, the pros and cons of each, and which tools will surface which datasets.
Lab data is perfect for benchmarking and testing site performance using a controlled environment and a standardized set of conditions. Popular Google Chrome tool, Lighthouse, calculates your Core Web Vital scores by simulating a mobile device running on a fast 3G network and slowed CPU, while also identifying opportunities to improve the user experience.
Lab data can be invaluable for getting a quick state-of-play and understanding the impact of recent optimizations, and it’s also ideal for testing a website before launch when real user data just doesn’t exist yet. However, it can’t be relied upon for a true indication of your users’ experience under real-world conditions.
Field data is crucially important for understanding how real users are experiencing your website. Field data analyzes how real people interact with and experience your website out in the wild, across different browsers, devices, internet speeds and other variables, to give you more accurate insights into your true Core Web Vitals scores than synthetic lab data. These real user insights can be gathered in two distinct ways - from a Real User Monitoring solution such as Raygun, or from a tool that uses the CrUX dataset, such as PageSpeed Insights.
While Google’s tools provide enough data for you to have some sense of your Core Web Vitals performance, RUM is key to understanding what’s happening in real time across all your visitors. In fact, Google’s team recommends supplementing their workflow with RUM for accurate data and diagnostics.
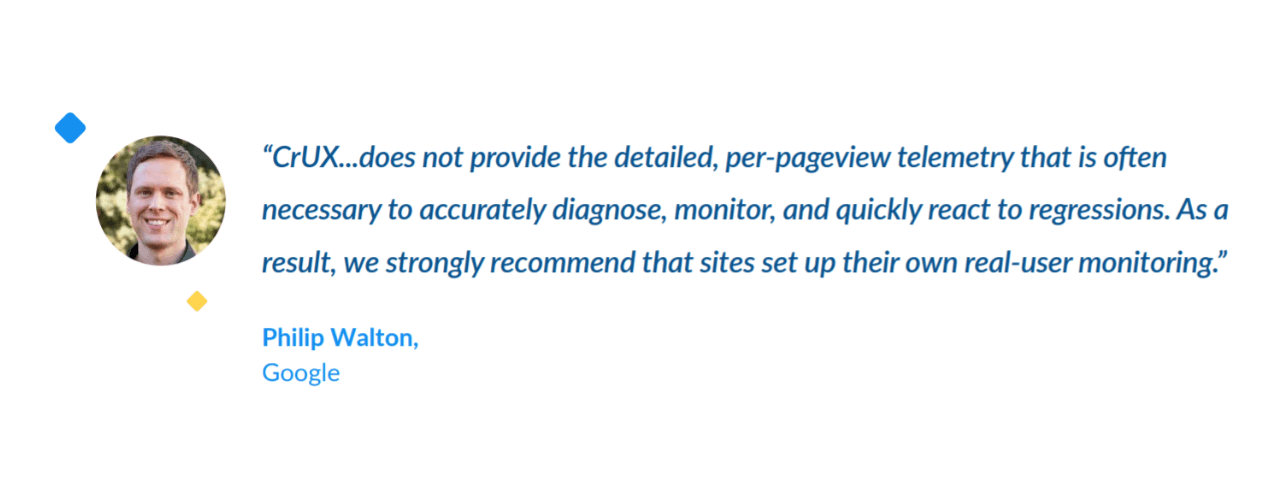
Core Web Vitals are still flying below the radar for many teams, but they aren't going anywhere anytime soon – there’s nothing quite like the indisputable industry-leader weighing in on the importance of web performance. Google has brought front-end performance directly into the boardroom, clearly connecting UX and business outcomes. Not only does this present a very real opportunity for developers to get the attention and investment they deserve, but also gives them widely understood metrics to focus on.
Surprisingly, your competitors likely haven’t caught wind of their importance yet, and their lag is your (potential) gain. This assessment of 500 prominent ecommerce sites found that only 16.6% were achieving “Good” on all three metrics, so by reading this report you’re already well ahead of the curve.
This window of opportunity won’t last forever. By taking a proactive approach to improving your scores, you not only gain an edge on your Google search rankings, but more importantly, lead the standard for what a great digital experience looks like.
Focusing on these metrics can pull you ahead of the pack. In the initial two months after the update that added Core Web Vitals to Google’s search ranking criteria, domains that weren’t meeting at least one of the Core Web Vitals values achieved 3.7% less Google visibility than domains that met all three thresholds.
As we know, search ranking isn’t the only benefit – Google picked these particular metrics for good reason. Core Web Vitals have a significant bearing on both bounce rates and conversions with faster, smoother sites resulting in a healthier bottom line. Shopify reports that 57% of shoppers have left a slow site to buy from a competitor. When shopping sites meet the “Good” mark on all three metrics, users are 24% less likely to abandon pages mid-load.
Core Web Vitals aren’t just an arbitrary benchmark – they’re the factors that make your site feel fast and seamless to your users and translate into real gains in revenue.
Google judges each of your Core Web Vitals independently, so it’s important to spread your optimizations across all three. Simply focusing on one or two metrics will backfire in the long run, so aim to get all three hitting “Good” for the best results.
When it comes to organic search, Google will monitor the performance of individual pages, not your entire site. Don’t get overwhelmed thinking you have to optimize every page and asset you’ve got - focus your attention on the pages that get the most web traffic and/or are of the greatest importance to your business.
Regardless of what tool you use to measure Core Web Vitals, your scores are defined in the same way and divided into three distinct categories: “Good”, “Needs Improvement”, and “Poor”.
The Core Web Vitals are heavily focused on the 75th percentile of users for the preceding 28-day period. For example, to achieve a ‘Good’ LCP score, 75% of your users must experience an LCP of less than 2.5 seconds. If you don’t meet this threshold, but 75% of your users have an LCP less than 4 seconds, then you’ll fall into the ‘Needs work’ segment. And if you can’t hit the threshold of 75% of users hitting an LCP of less than 4 seconds, then (you guessed it) you fall into the ‘Poor’ category.
Google defines a “Good” experience when 75% or more of your users experience the following:
.png)
Once you’ve met these thresholds for “Good”, your search ranking won’t be impacted by any gains above and beyond this. However, the other benefits associated with better scores (conversions, trust, reduced bounce, etc) are obviously still in play.
Let's run through some common Core Web Vitals hurdles, with actionable tactics to improve LCP, INP, and CLS on your own site.
Make sure critical-path CSS for content above the fold lives in <head>
Make sure any custom or heavy widgets that require external API calls or third-party code (e.g. ads or social buttons) sit below the fold
Then, preload anything above the fold, and defer loads below the fold
Be discerning about your pop-ups and plugins – does the value they deliver make up for the lags they introduce?
Reduce server response times by caching assets
Optimize and compress image and text files
Install a CDN to get around region-based navigation delays
Review your image sizing and formats
Compress and minify code in your web pages and script files
Remove any unused CSS or JavaScript
If you’re using long-running code, break it into smaller, asynchronous tasks, and introduce lazy-loading
Load heavy scripts for less essential components off the critical path
Avoid having multiple heavy widgets on the same page
Restrict the number of custom fonts used, ideally to a maximum of two
Always specify dimensions on your images and video elements
Avoid dynamic ads and banners that will displace other page elements, and instead leave a large “placeholder” space for the ad to load into
Now that we’ve armed you with a list of tactics, it’s time to get to work. Implement our simple four-step workflow to identify opportunities, improve your Core Web Vitals, and delight your users. To follow this workflow effectively, you’ll need a dedicated Real User Monitoring tool, PageSpeed Insights, and Lighthouse.
First off, take a glance at how your website is performing across all three metrics with Real User Monitoring. In Raygun, you can use the P75 toggle to see how your site stacks up against each Core Web Vital at a high level, and detect if there are any recent spikes or trends that require immediate attention.
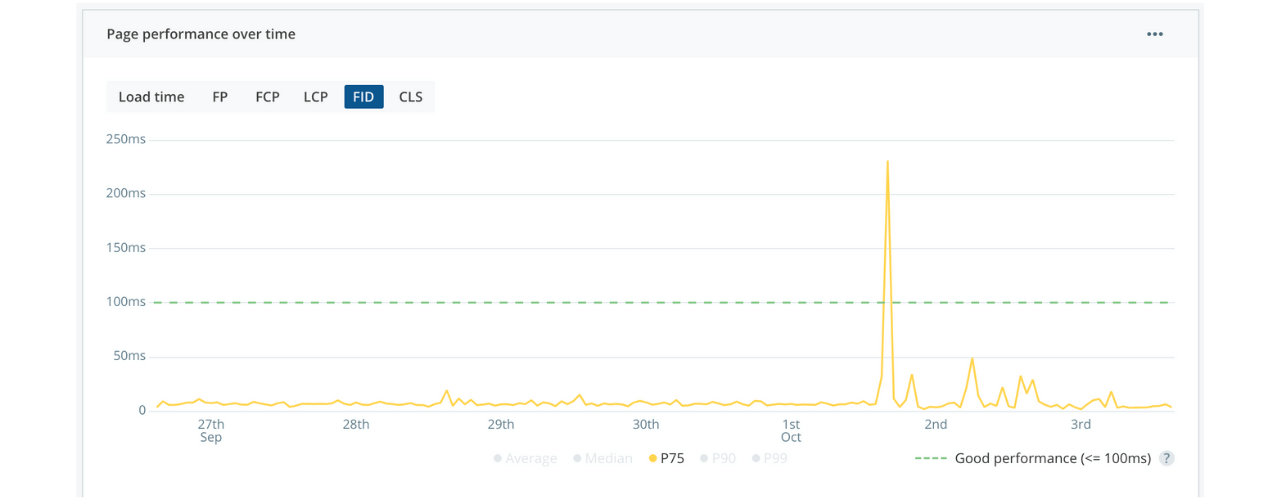
Since Core Web Vitals are calculated on a per-page basis, you’ll now need to identify the pages of your site that offer the greatest opportunities for improvement. There are three things to consider when shortlisting pages for further discovery: traffic, importance of page, and room for improvement.
Modern RUM tools automatically group the slowest and most requested pages. This provides a great starting point to drill into individual pages and see how they score against each Core Web Vital. Follow this process to identify a single page, or even better a specific Core Web Vital on a page, and continue to step 2.
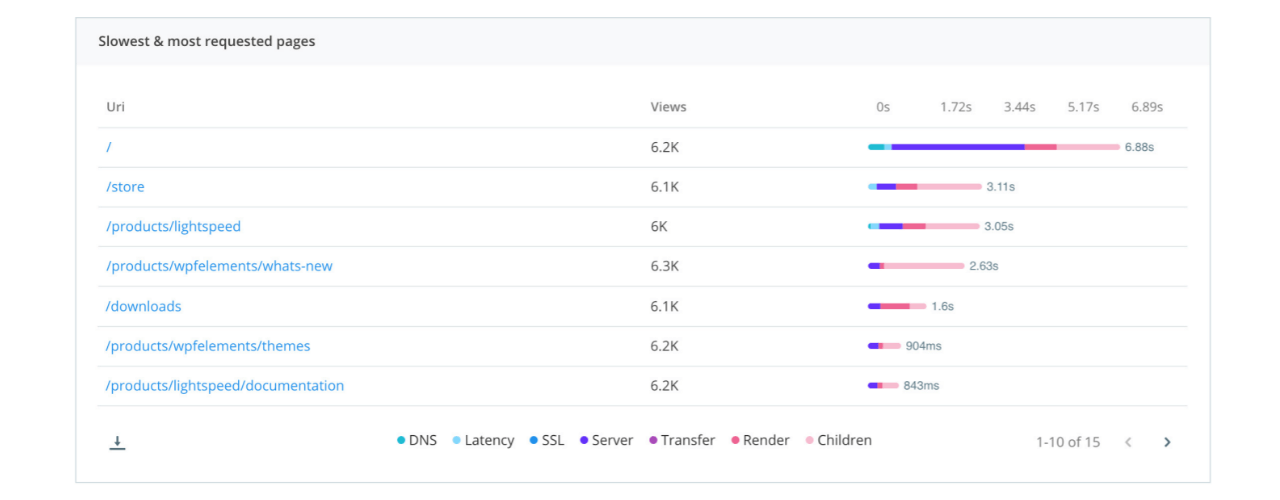
Now that you know what you want to improve, it's time to figure out how.
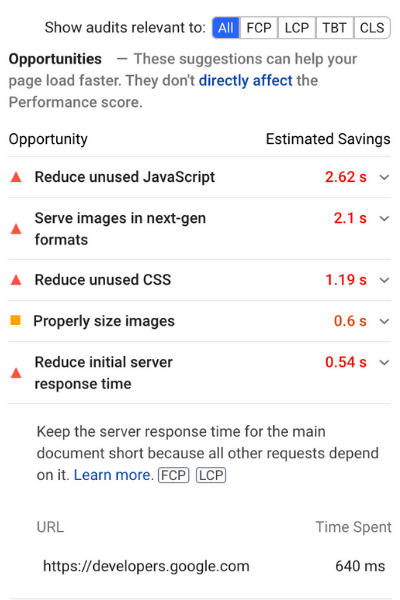
The fastest way to shortlist specific optimizations is by using PageSpeed Insights. Simply enter your page URL and PSI will automatically provide a list of actions, alongside their estimated impact.
At this point, you need to look into common Core Web Vitals inhibitors and best practices specific to your tech stack and objective. There are lots of solid resources and developer blogs sharing first-hand experiences of improving Core Web Vitals (not to mention our list of tactics above).
For even greater context, you can validate ideas against real user insights. RUM gives you instance-level diagnostics on every page request with a full waterfall breakdown of load times across DNS, latency, SSL, server, and transfer times. Some RUM tools will even allow segmentation by geolocation, device and browser type.
Remember to take note of your Core Web Vitals scores according to both CrUX and Lighthouse datasets, as these will be useful for further testing and iteration in step 3.
Using the information gathered in step 2, it’s finally time to take action on the scores that are hindering your website performance. After making an optimization, refer to your Lighthouse scores. Lighthouse uses lab data, meaning you can see changes to your Core Web Vitals immediately after implementing optimizations, without having to wait for real users to interact with your page. This is an effective way to get an early indication of the impact of your changes.
Next, you’ll need to see how these changes manifest in the hands of your real users. While the lab data from Lighthouse was a good initial guide, you’ll need to crosscheck your improvements with a Real User Monitoring solution. RUM depends on real website traffic, so the amount of time you’ll need to wait in order to get meaningful insights will vary from page-to-page, site-to-site.
With enough traffic, you can use RUM to see the impact of your changes soon after they go live, by adjusting the timeframe to only show new traffic since the last deployment. RUM will show the impact of optimizations on your real user's digital experience. Use this data to learn quickly and make informed decisions about what worked and what didn’t.
RUM lets you track the success of your changes over time, to keep a keen eye on how your scores are trending. You can monitor and compare specific timeframes, or view the line graph to see trends of each individual metric over time. We highly recommend setting up alerts in RUM to notify you if any Core Web Vital metric drops below a standard that you’re happy with. This will give you peace of mind that your users are consistently getting the experience they deserve.
28 days after implementing your improvements, check whether your Core Web Vitals have improved in Google’s eyes (your CrUX data). This is the moment of truth and the final payoff, so we’ll have our fingers crossed for you. You got this.
Let’s take a look under the hood to understand what makes Raygun’s first-class support for Core Web Vitals so powerful.
Raygun gives you complete control over user data so you can surface the insights that matter to you and your business. Overlay top-level filters such as country, browser, URL, OS, device, and even custom tags, to help narrow your focus.
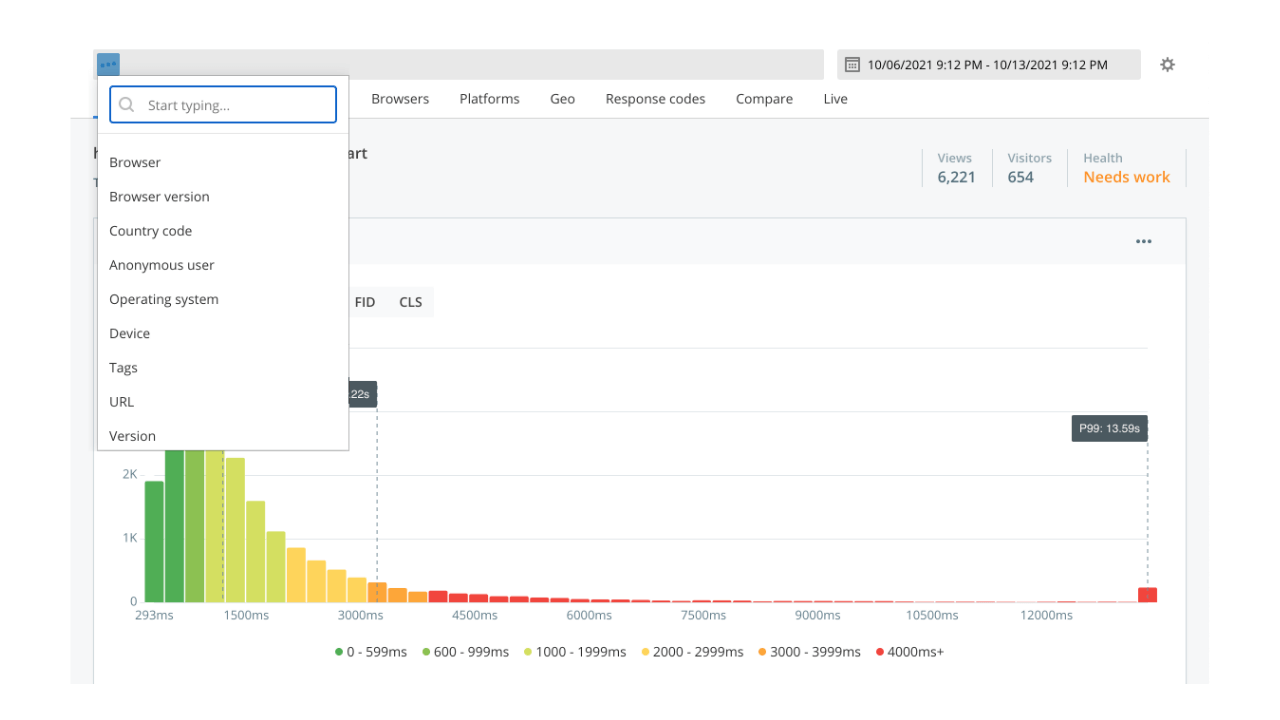
Explore commonalities in users who have lower scores, or segment your audience to see how your most valuable customers are experiencing Core Web Vitals on your site. If the majority of your customers are based in the United States, for example, you can filter your traffic to see exactly how users in the U.S are experiencing each of your Core Web Vitals and optimize accordingly.
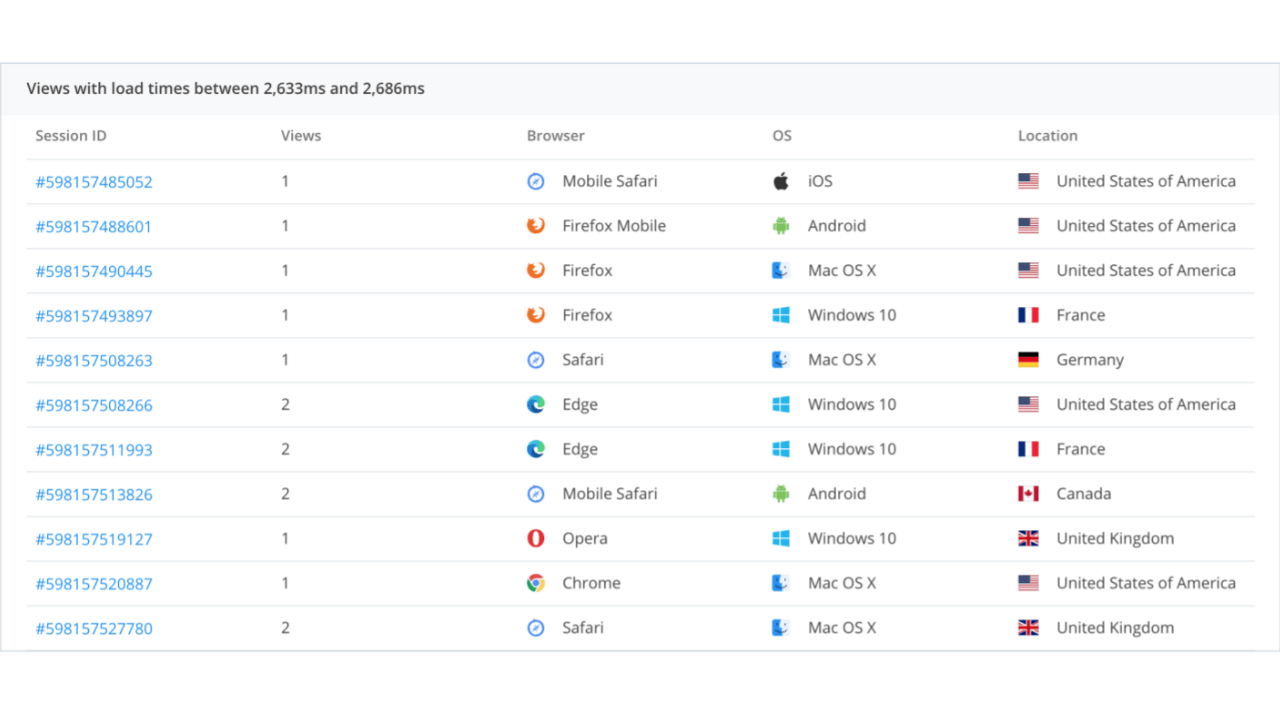
Monitor how users are distributed across each Core Web Vital in the page performance histogram and see exactly who has been impacted by each Core Web Vital score. Spot problematic cohorts and hover and click into specific histogram bars or scores to see the number of users affected and the full list of users and sessions.
%20(1).png)
From here, you’ll be able to see who makes up each of these cohorts, with contextual information such as location, browser, and operating system. Dive into individual sessions to see what pages they have visited along with performance diagnostics of every page request showing a full waterfall breakdown of load times across DNS, latency, SSL, server, and transfer times. This will give you the power to easily spot issues and replicate them on your own device.
Monitor how your Core Web Vitals are trending over time to track the success of optimizations on real users. By selecting the P75 filter on the performance over time graph, you’ll be able to see where you fall on the spectrum of “Good”, “Needs Work” or “Poor” for each of your Core Web Vitals.

Trends can be extremely valuable for identifying abnormalities in your scores over time, especially when used in conjunction with top-level filters. Monitor trends at an individual page level for greater visibility and context into what actions have the biggest impact on your page’s performance so you can learn and optimize quickly to improve your scores.
By setting up custom alerts, you can ensure that you’ll never miss a fluctuation in your Core Web Vitals scores. When used in addition to top-level filters such as location, browser, URL, and more, you have complete control over what triggers an alert.

Google’s introduction of Core Web Vitals gives you a chance to boost customer experience and prove the value of your work. You need to act fast to gain competitive advantage and capitalize on these measures – Core Web Vitals, and the broader Web Vitals program, will continue to evolve and expand as Google builds and iterates on them as a measure of experience. But while the latest metric may change, search rankings and business success will only be increasingly tied to the perceptions of the user.
While you can make crucial progress by addressing Core Web Vitals now, creating an overall culture of customer-centric development will keep you ahead of the curve going forward. Investing in Real User Monitoring as a critical connection between your code and your customer will set you up for ongoing success.