Enter your details to view and download the full PDF version

Real User Monitoring (RUM) provides visibility into the performance experience of real users interacting with your application. With a Real User Monitoring tool, you can monitor front-end performance, and understand how your optimizations are improving the user experience.
RUM tools have evolved to bridge the gap between application performance and its impact on user experience. The user-level insights a RUM tool provides help teams to focus on the right performance opportunities, deliver a fast application, delight customers, and achieve business objectives.
The three main benefits of Real User Monitoring tools for web, mobile, and single-page applications are:
1. Identify and diagnose front-end performance problems impacting your users
2. Measure the impact of optimizations and changes you have made
3. Understand exactly how real customers experience your application
Let’s look at them in more detail.
Many teams lack visibility into performance problems in production environments. RUM helps you identify poor performing parts of your application that may be impacting the user experience.
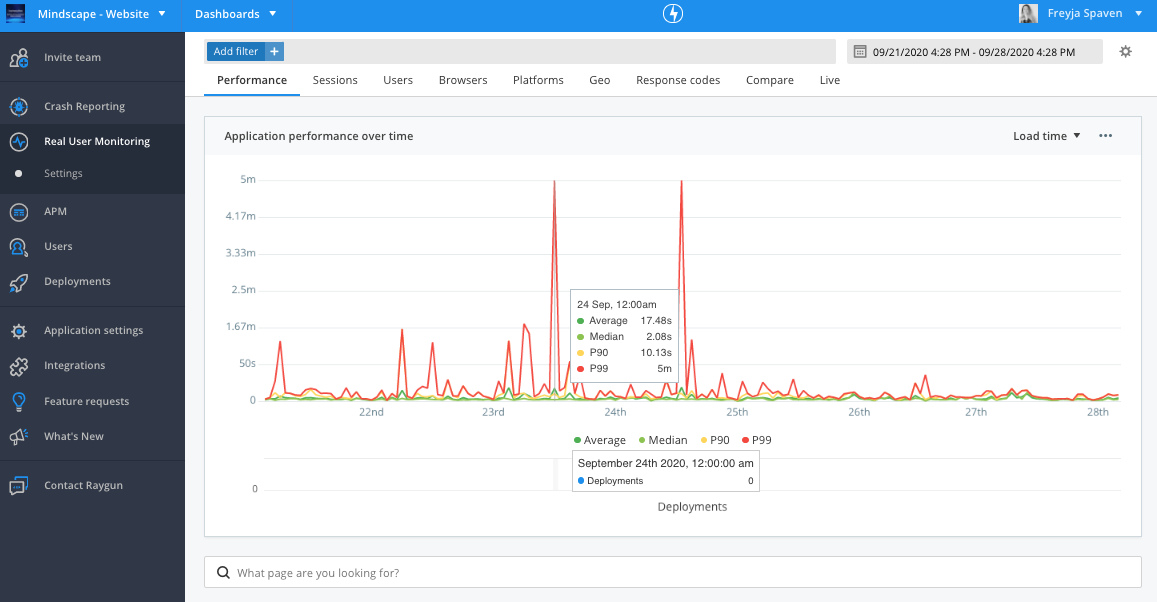
If you’re concerned about performance on your app, consider using the Performance page in Raygun RUM. Once you’ve followed the easy installation process, you’ll get instant visibility into the trends in front-end software performance for your application.

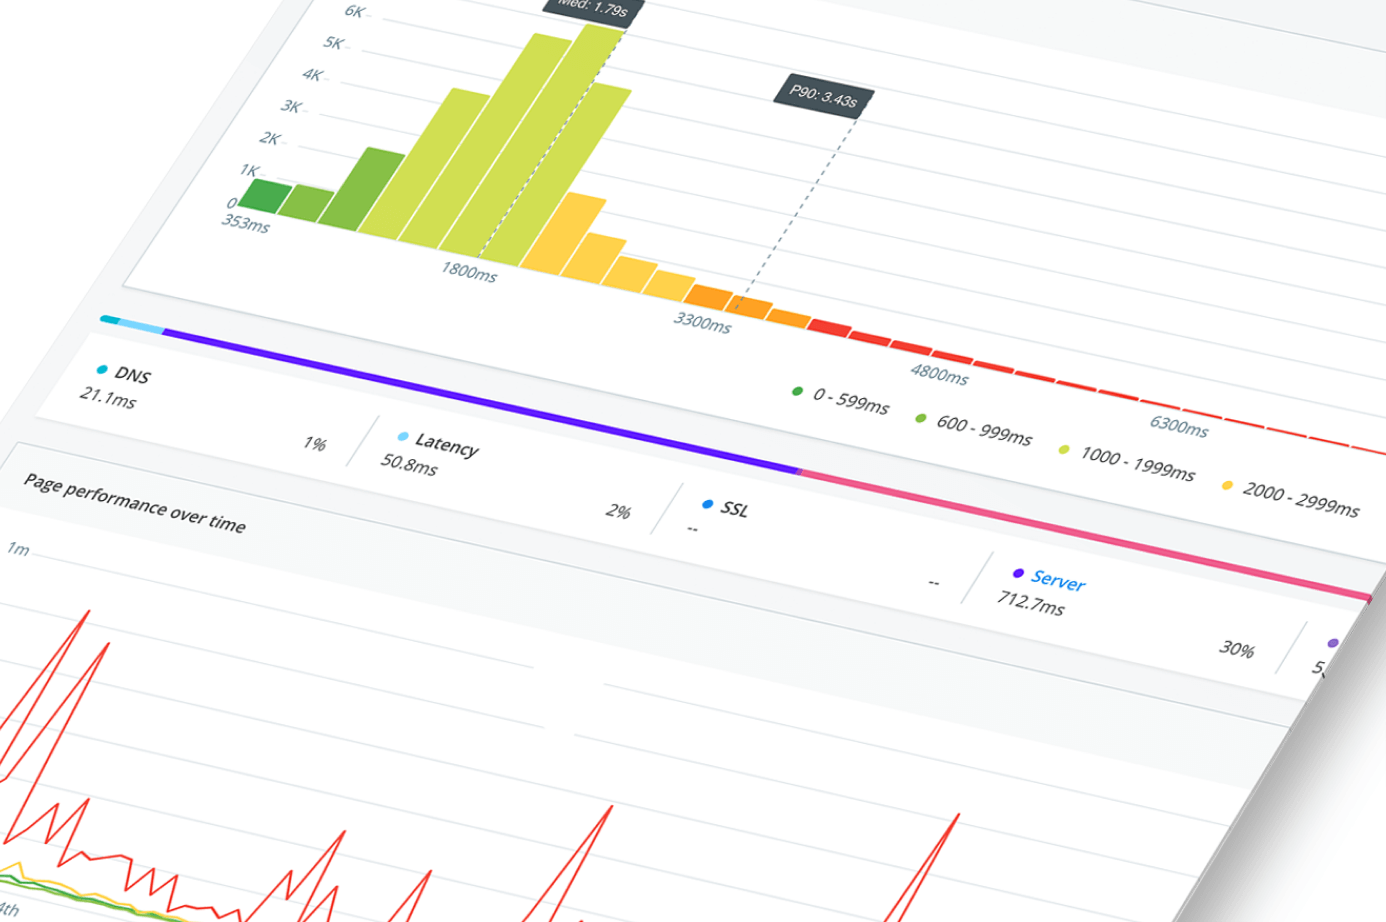
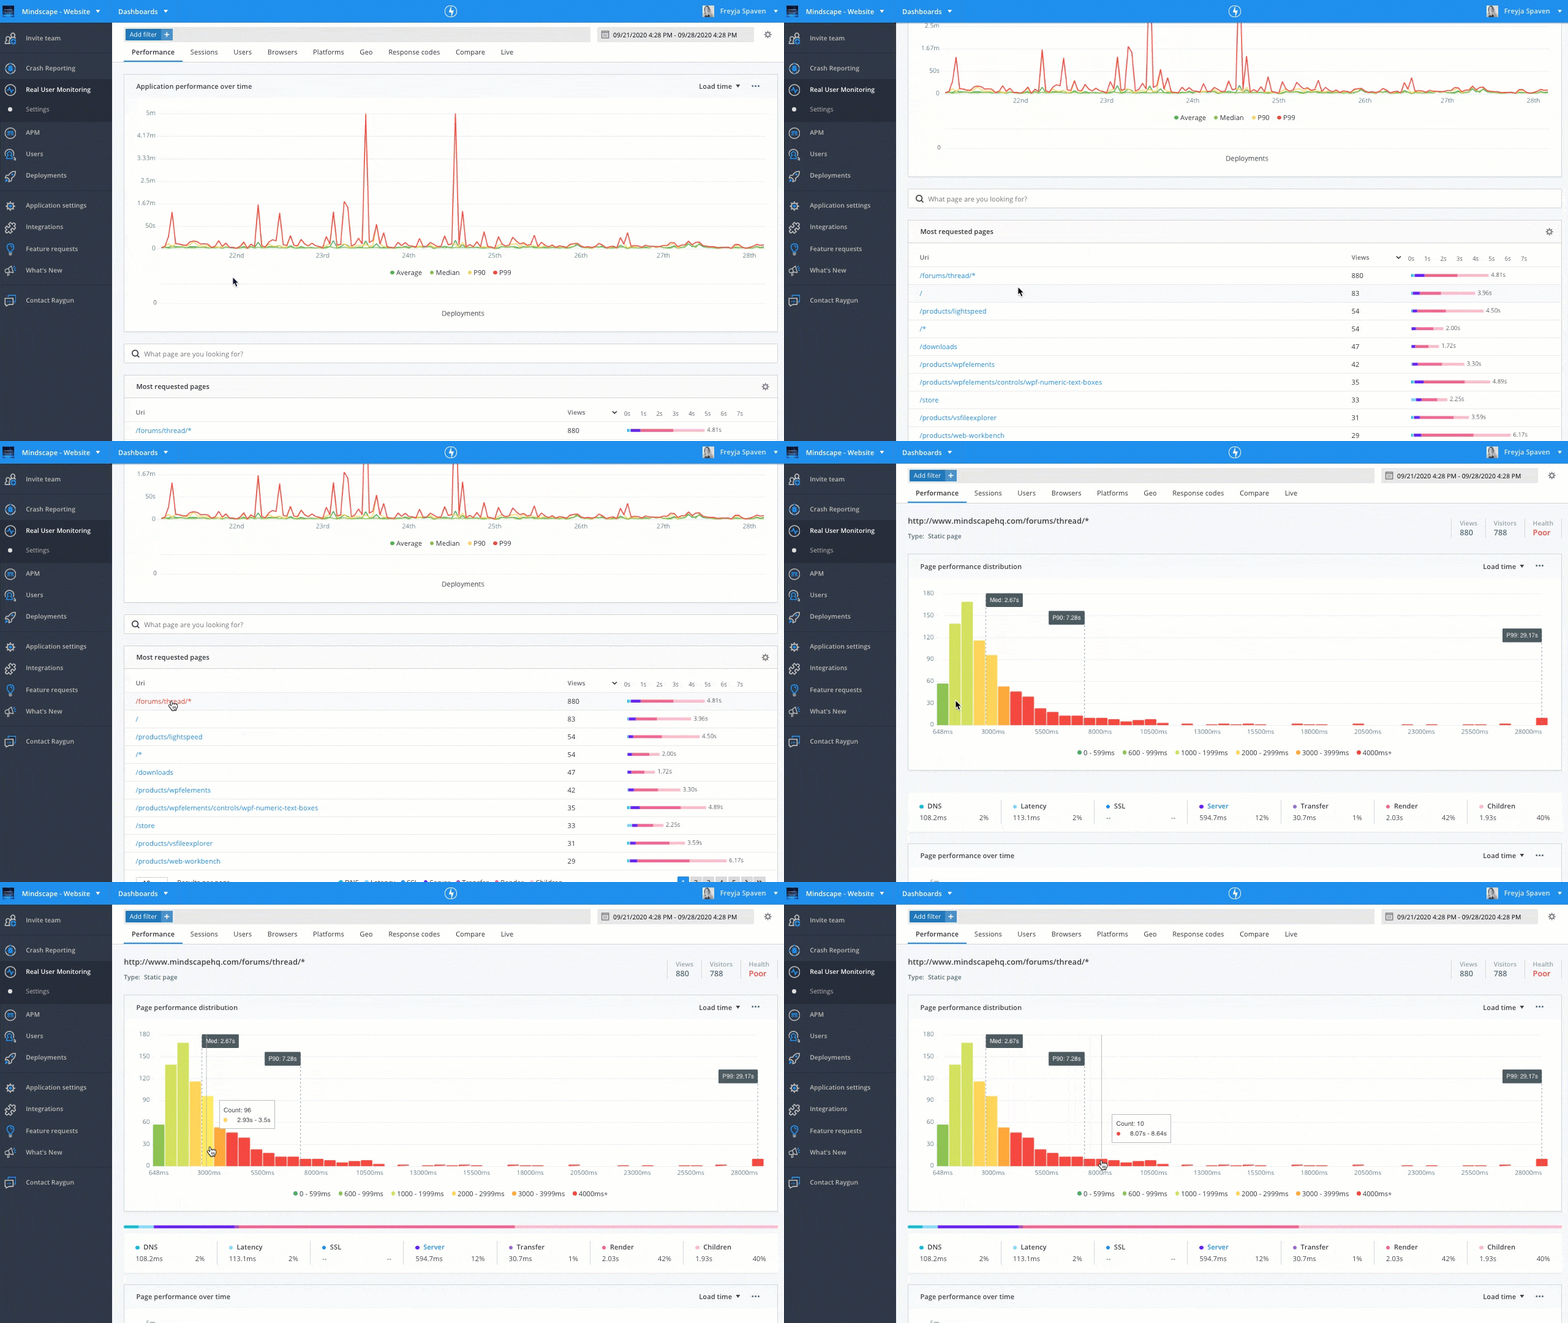
To take the investigation further, you can drill down to view the performance of particular pages (or XHR requests). Usage analytics also help you understand how many users have been impacted by a slow page load.

RUM captures user-centric web performance metrics like First Paint and First Contentful Paint, which are useful for understanding how fast a user perceived the load time of the page. Paired with Raygun’s custom timings feature, you can also instrument your own custom performance metrics to measure the performance timings that matter to you and your business.
With all these metrics, at both the application and page level, you can identify where customers experience poor performance in just a few clicks. With easy workflows to surface page-level performance diagnostics and details down to each specific page request, RUM provides all the information you need to diagnose the cause of poor page performance.
Once you’ve diagnosed a performance problem, you should have all the information you need to be able to make improvements. Next, you’ll want to measure the impact of the performance optimizations you’ve made.
If you’ve made a change and improved performance, you’d expect to see a drop in the trend lines on the main Performance page.
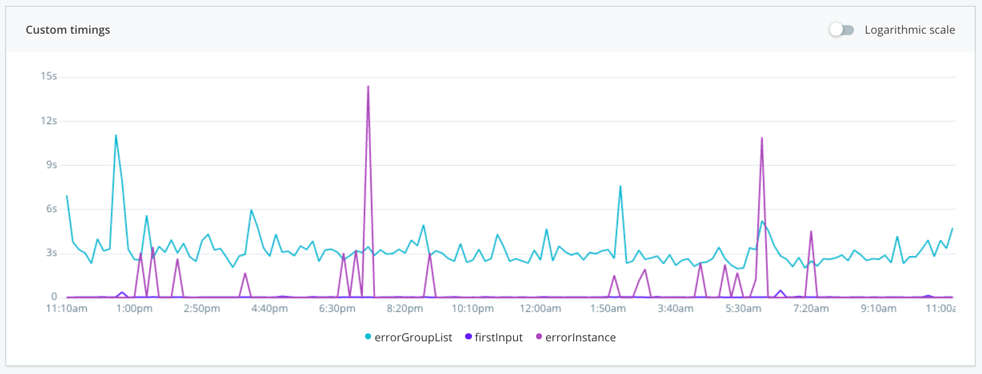
But what about if your optimization was focused on a particular page, XHR or view? RUM will give you the granularity you need to filter Median, P90, and P99 load time. Or, with custom timings graphs, like this example in Raygun, you can see the trend for particular custom performance metrics.

Viewing performance metrics over time helps to strengthen the link between site speed and business outcomes. You can see how the work of your developers is helping to improve the user experience, and thus business outcomes.
In a recent survey among tech leaders, we found that customer experience is almost exclusively measured using Net Promoter Score (NPS). NPS isn't a perfect measure of customer experience as it’s often subjective. Software performance and software quality can be quantified using tools like RUM and should be part of the customer experience conversation.
For example, Raygun RUM offers the ability to retrace the steps of users of your application and view the performance at each stage of their session. You can configure Raygun to attach authenticated user’s data to sessions. Search for particular users, drill into the sessions they had, and then see the instance-level diagnostics for each page in that journey.
You can find all the user sessions in your application and drill into any to see how a user interacted with your application. You can also gain insight into the performance at each stage by clicking into those instance-level performance insights. This allows you to see how poor performance might’ve caused a user to leave your site.
Raygun RUM gives visibility into each stage of the user journey and how the performance was throughout.
A core function of Real User Monitoring solutions is that they monitor the experience of actual users interacting with your application. Synthetic monitoring simulates user traffic to measure application performance, and it’s useful in testing environments for gauging the application performance.
However, RUM products are essential for gaining an accurate picture of how the application performed where it matters most; in the hands of real users. Several environmental factors such as the user's browser, device, operating system, and network connection can influence performance, so it's impossible to simulate every scenario. RUM helps to fill that gap for visibility into the customer experience. Therefore, RUM and synthetic testing work well together.
It’s important to monitor and improve the performance of both server and client side to deliver a good user experience, which is why leading Application Performance Monitoring (APM) tools come with built-in Real User Monitoring.
RUM surfaces meaningful diagnostic information on front-end performance so you can ship fast, performant front-end code, and deliver the best possible user experience. APM monitors the performance of server-side code and offers detailed code-level insights into how to improve it, helping you to reduce infrastructure costs and to create a faster application for your users.
RUM and APM work together to connect the end-user experience to server-side problems, meaning you can identify the most significant opportunities to improve real users' performance.
For all it’s benefits, RUM does have some limitations:
Building fast-performing software is critical to delivering a great user experience, so teams need to understand the impact the work has on the end-user. Great user experiences lead to better business outcomes, therefore having a high performing, error-free application is crucial to success.
Here at Raygun, for example, RUM has helped us save our customers 75 hours per month by validating the removal of inefficient code. Our development team was also able to make an 83.8% performance improvement to a React component with the custom timings feature. RUM helps us to continually improve the performance, and thus the user experience, of our own apps.
Traditional RUM products only surface basic front-end performance insights for your application, with no data about how users interact with different parts of your application or what the user’s session was like. This is where Raygun is different; we surface meaningful diagnostic performance information in the context of user experiences, so you can ship well-optimized performant code, and deliver the best possible user experience.
You can read more about how Raygun compares with other RUM tools in this article.
The end-user demand for fast performing software is only increasing. Fast applications are crucial to delivering excellent customer experiences, keeping customers engaged, and driving good business outcomes. Performance is no longer solely in the best interest of the engineering team, but the business as a whole. There are now more stakeholders who are invested in the performance of the software, as performance is tied to business outcomes, but the responsibility of being fast remains in the hands of the engineers.
Organizations need modern monitoring solutions like RUM that acknowledge the inextricable link between performance, user experience, and business outcomes.
With Raygun RUM, you’ll get full visibility into the user experience in minutes with our SDK. We support all major JavaScript frameworks for web, mobile, and SPAs, so if you haven’t yet tried Raygun Real User Monitoring, sign up for a free 14-day trial.